Going Beyond Four Genes (Part 4)
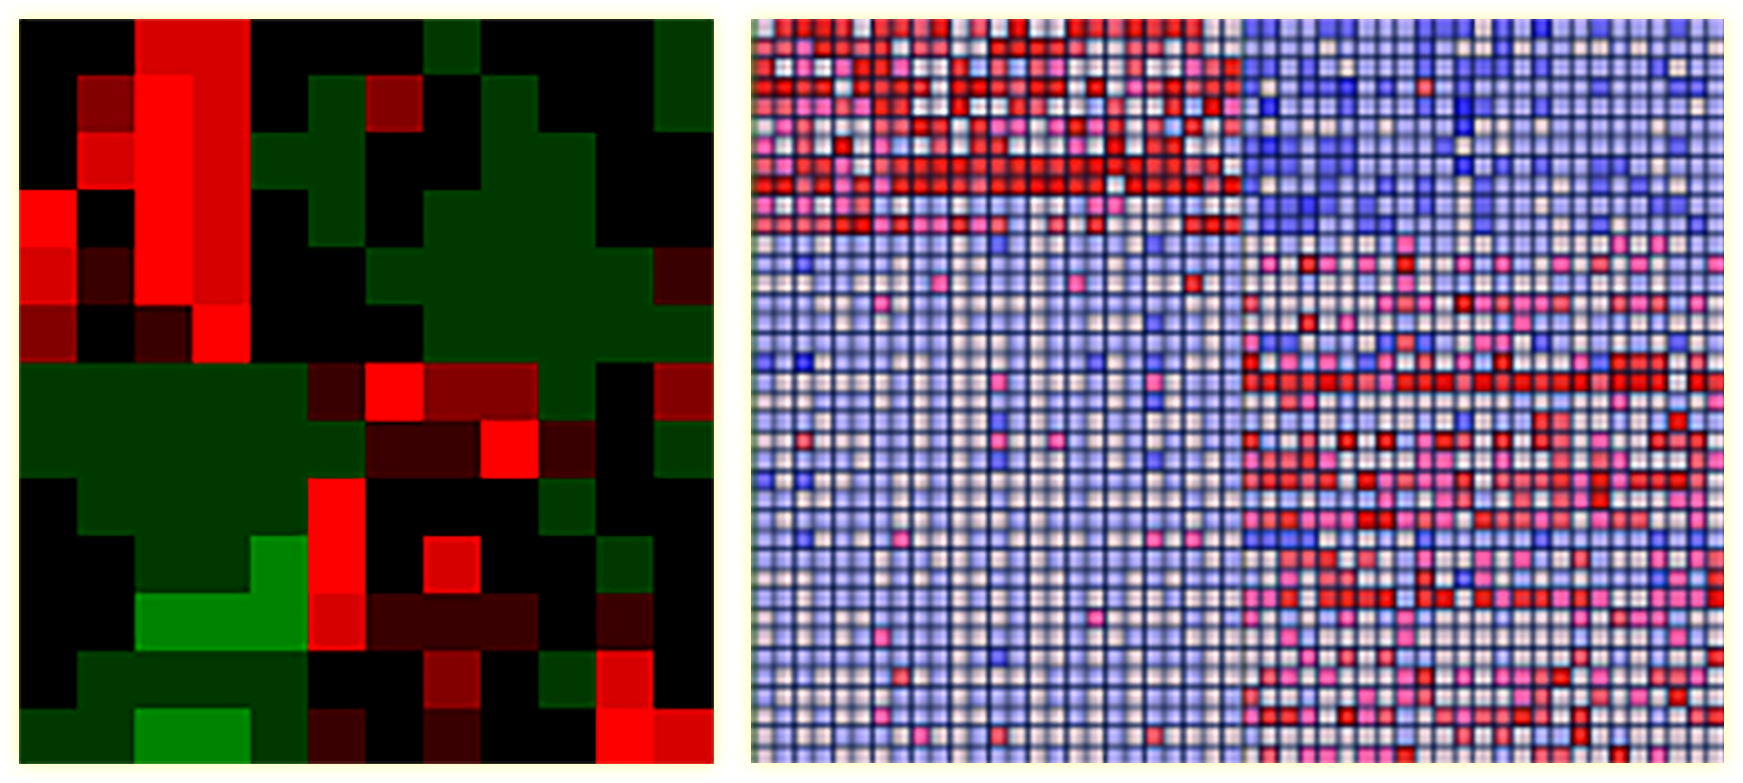
Our example’s data are a subset of leukemia data (50 genes with 38 samples).
The two sample groups represent acute lymphocytic leukemia (ALL) and acute myelocytic leukemia (AML), which express different sets of genes.