Hierarchical Clustering: Step 2
Next, we average the log-transformed expression levels for the clustered genes (in this case, B and D) and recalculate the similarity scores:
| Gene A | Gene C | Gene [BD] | |
|---|---|---|---|
| Gene A | 1 | −0.633 | 0.564 |
| Gene C | −0.633 | 1 | −0.305 |
| Gene [BD] | 0.564 | −0.305 | 1 |
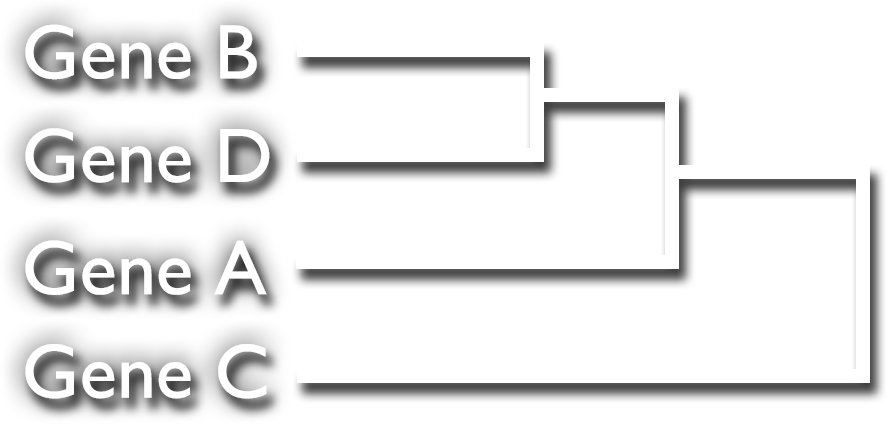
We pick the next highest score, A and [BD], to form the cluster [ABD]. Since we have only four genes, we are done, but this is an iterative process until we are left with a single pair. The end product is a dendrogram, a graphic representation of clusters: