Interpreting Microarray Data: Converting Light Intensities to Numbers
Before data can be analyzed, the different colors of the dots have to be converted to numbers. There are many approaches, but here we show a simplified version of a common technique. Let us consider a simple case involving only four genes.
First, each spot is converted to a number that represents the intensity of red dye and green dye. In this example, we use arbitrary light units.
Next, we calculate the ratio of red to green (red ÷ green).
Red (tumor)
light intensity
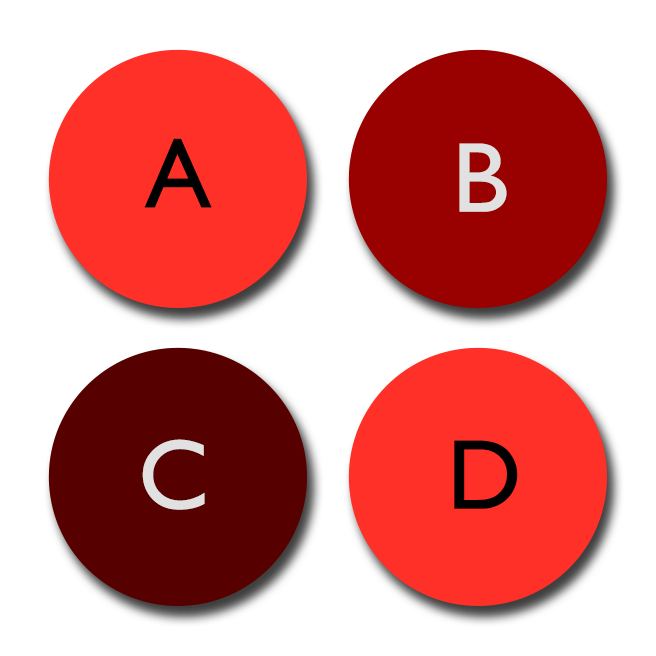
| Gene A: 400 | Gene B: 200 |
| Gene C: 100 | Gene D: 400 |
Green (normal)
light intensity
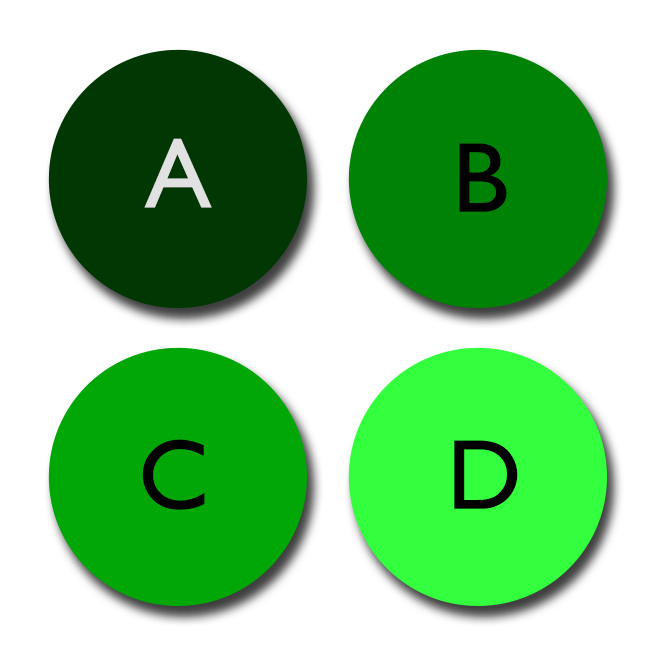
| Gene A: 100 | Gene B: 200 |
| Gene C: 300 | Gene D: 400 |
Ratio red/green
(tumor/normal)
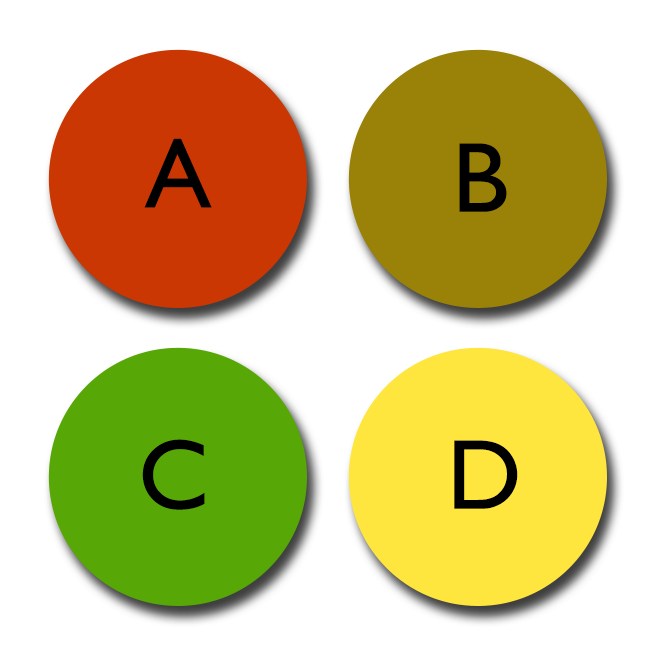
| Gene A: 4 | Gene B: 1 |
| Gene C: 0.33 | Gene D: 1 |