Case Study: Mosquito Eradication Program (Part 12)

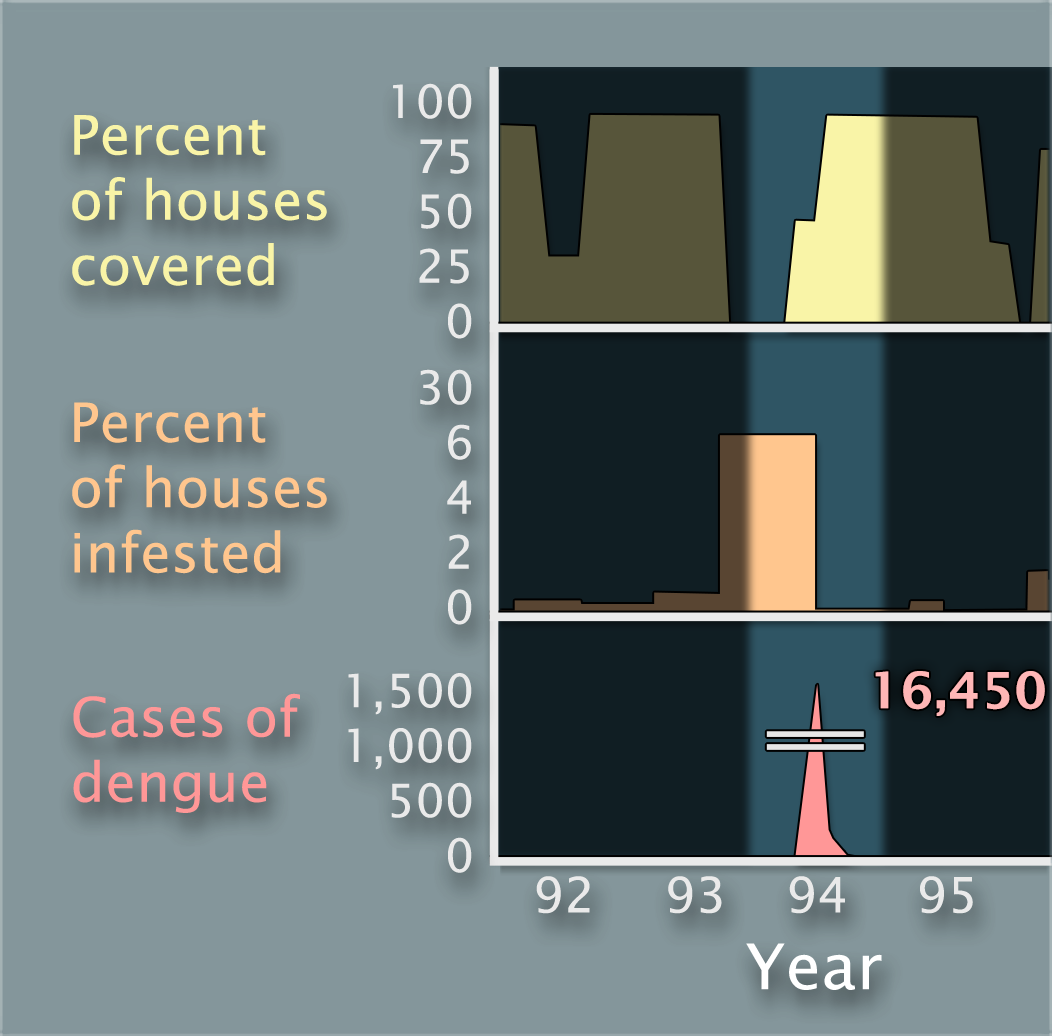
In 1994 you can see a big dengue spike, an epidemic outbreak that is off the scale at over 16,000 infections.

The rise of the spike in dengue cases corresponds with a jump in the percentage of infested households.

Six months prior to the dengue spike, household interventions had halted.

Note: Interventions halted when health care workers were diverted to a cholera outbreak.

Three stacked graphs titled Percent of houses covered, Percent of houses infested, and Cases of dengue, double as the y-axes. The x-axis of all 3 graphs is labeled Year and ranges from 1992 to 1995 with 1994 highlighted.  The data show a lapse in houses covered the first half of 1994, then increasing to over 75% in the second half of the year. About 6% of houses infested in the first half 1994 dropping to 0 in the second half. Cases of dengue spiked from 0 to 16,450 mid-1994 and then back to 0.
Percentage of houses covered by mosquito interventions vs. percentage of houses infested with mosquitoes vs. cases of dengue in Fortaleza in 1994