Case Study: Mosquito Eradication Program (Part 4)

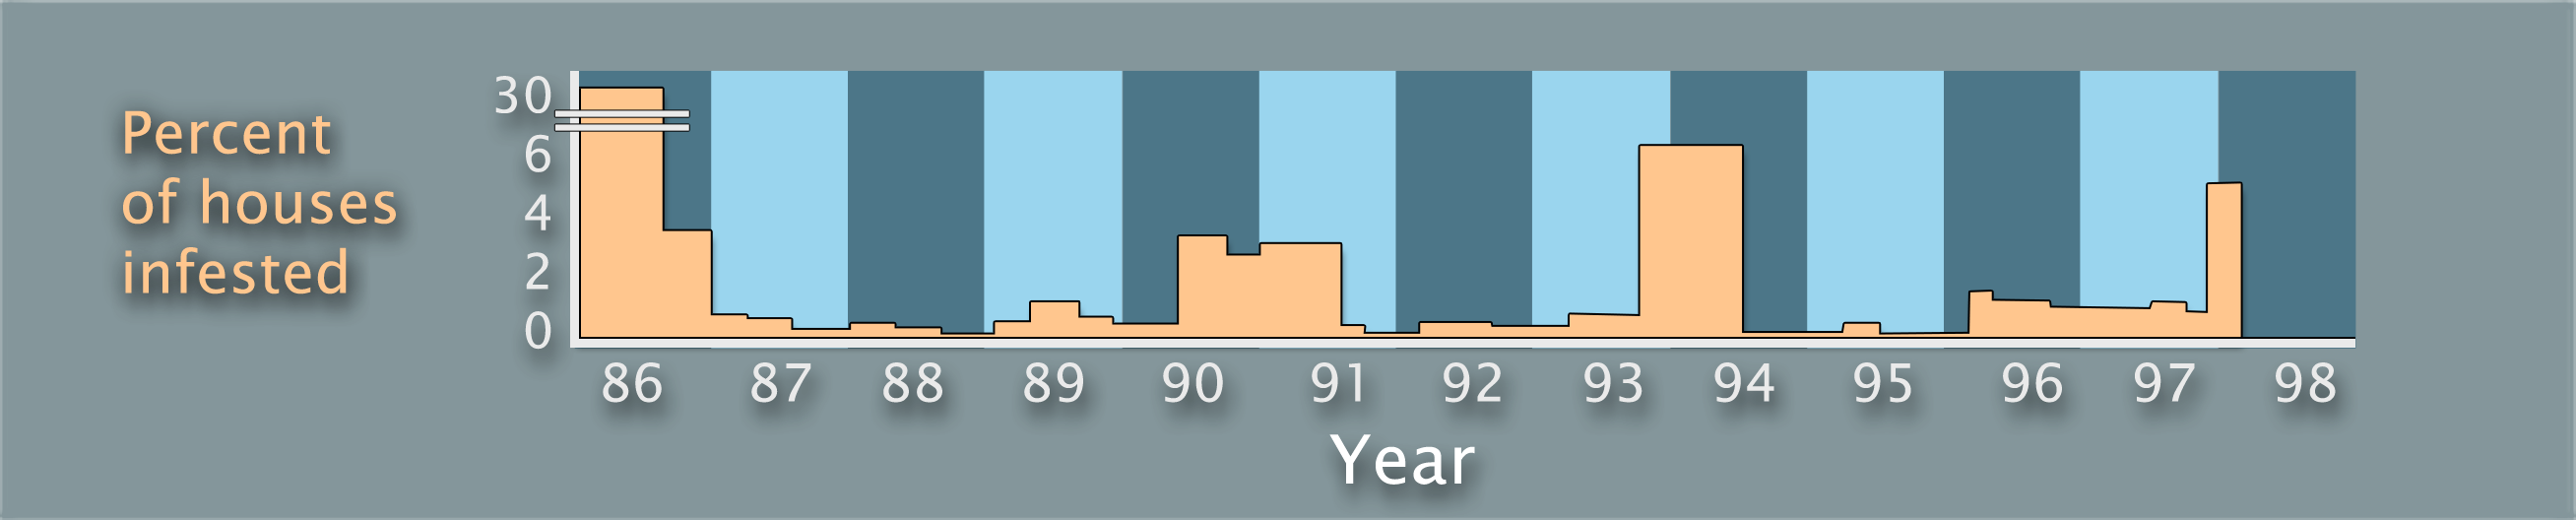
This graph shows the percentage of houses infested with mosquitoes.

  • What cycles or patterns do you see in this graph?
  • Are all the houses infested?
  • Are there times when no houses are infested?
  • What is the range for percentage of houses infested?
A graph titled Percent of houses infested, which doubles as the y-axis. The x-axis is labeled Year and ranges from 1986 to 1998 in increments of 1 year. Mosquito infestations are shown in 1986 to 1988, 1989 to 1991, 1992 to 1994, and 1996 to 1998.
Percentage of houses infested with mosquitoes in Fortaleza from 1986 to 1998