Case Study: Mosquito Eradication Program (Part 5)

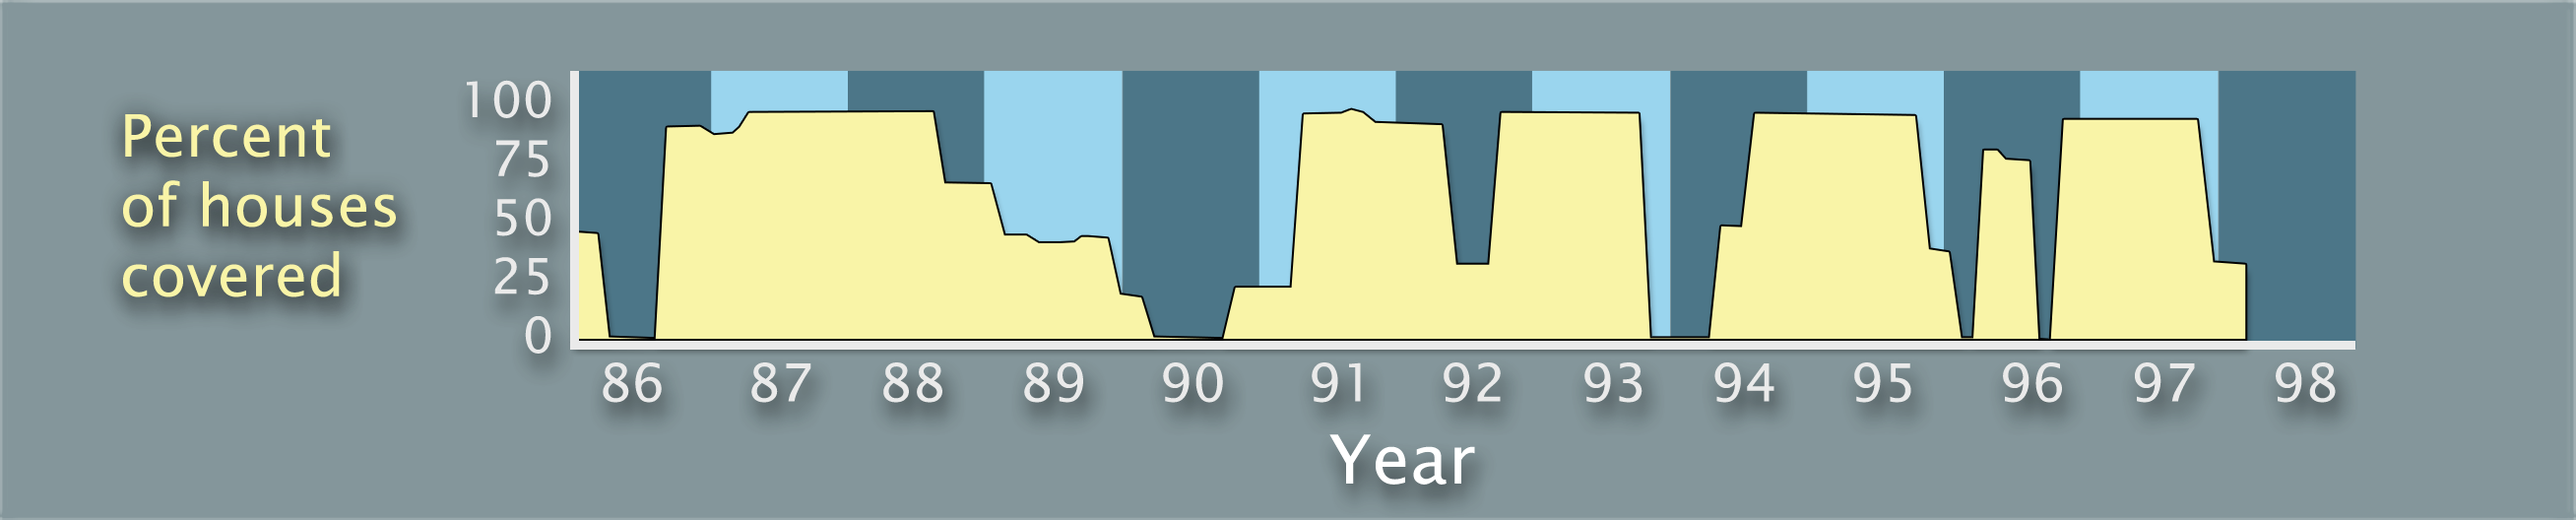
This graph shows the percentage of houses that were covered by the mosquito interventions.

  • What is the predominant pattern that you see?
  • What is the highest percentage of houses covered?
  • What might prevent coverage from being 100%?
A graph titled Percent of houses covered, which doubles as the y-axis. The x-axis is labeled Year and ranges from 1986 to 1998 in increments of 1 year. Mosquito interventions are shown in 1986, 1987 to 1990, 1990 to 1993, 1994 to 1995, 1996, and 1997 to 1998.
Percentage of houses covered by mosquito interventions in Fortaleza from 1986 to 1998