
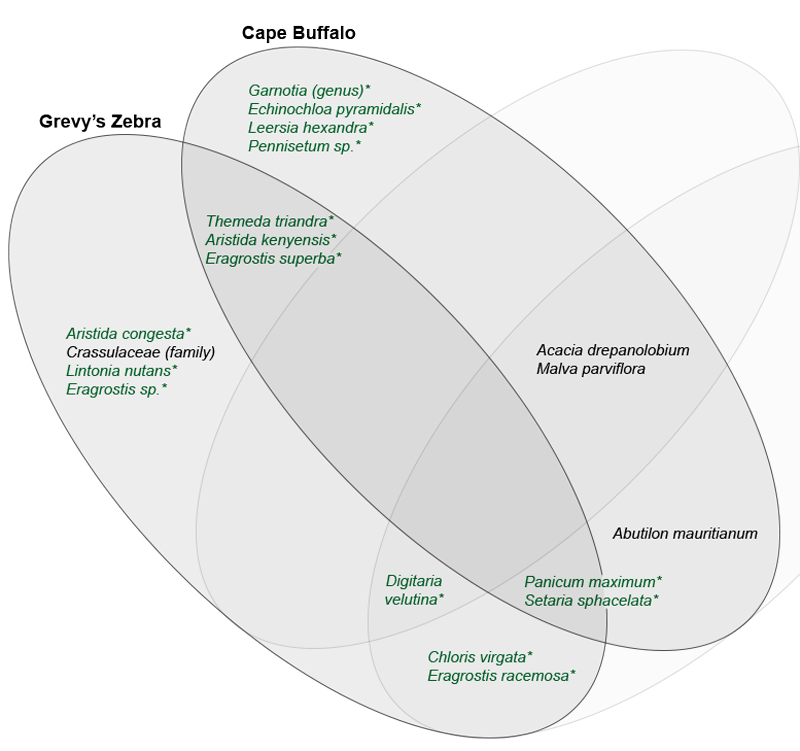
Let’s Measure Overlap for Grevy’s Zebra and Cape Buffalo

In this case the calculation is:

Sorenson's index formula 2 × number of shared plant species =2×5 =10 2 × no. of shared species + no. species for zebra (animal 1) only + no. species for buffalo (animal 2) only =10+7+7 =24

Sorenson's index answer 10 / 24 = 0.42

Sorenson’s index values range from 0 to 1. High values indicate high overlap, while low levels indicate little overlap.

To express overlap as a percentage multiply the index values by 100. The diets of the zebra and buffalo overlap by 42%.

Image of Venn Diagram showing all the plant species found in dung samples from Grevy's Zebra and Cape Buffalo.
Venn Diagram showing all the plant species found in dung samples from Grevy's Zebra and Cape Buffalo (Plant species in green and marked with an asterisk (*) are grasses and those shown in black are browse.) Show data in table view