
Sorenson’s Index Measures Similarities

The Venn diagram helped show that herbivore diets are somewhat distinct. To quantify how similar or divergent the diets are, you will calculate the Sorenson’s index for different pairs of herbivores.

Additional Information: Sorenson’s index is frequently used in ecology research to measure the similarity between two samples. In this case, it shows how similar the diets of two herbivore species are.

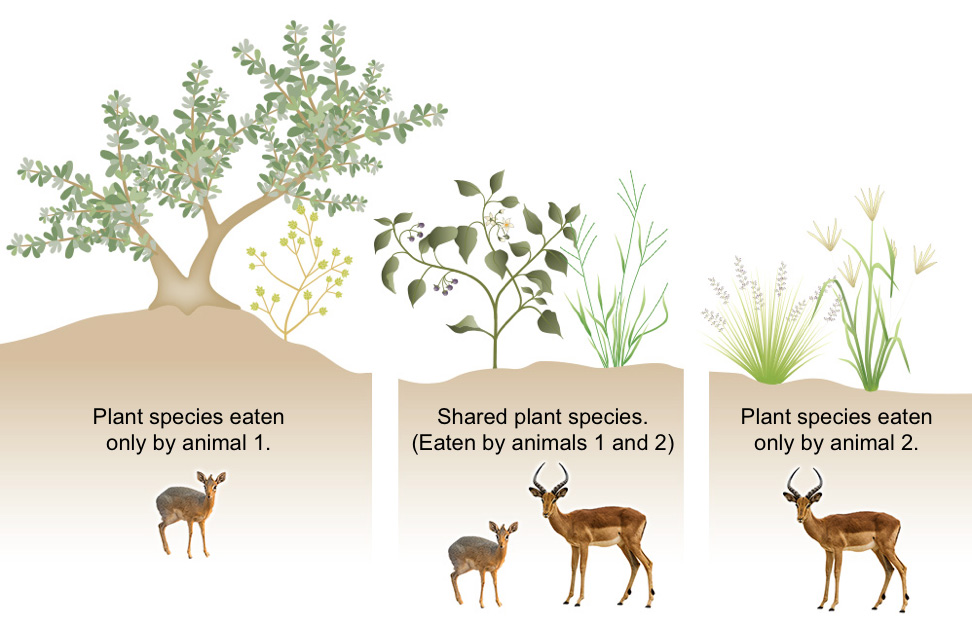
Sorenson’s index compares the number of plant species eaten by each of two animals with the number of plant species eaten by both.

A three panel illustration demonstrating the diets of two herbivore species. The panel on the left shows a large tree and a bush on a hill with a small four legged animal stating plant species eaten only by animal one. The panel on the right shows two kinds of grasses with a different four legged animal stating plant species eaten only by animal two. The middle panel shows both species together with two different plant species stating shared plant species eaten by animals one and two.
Distinction and similarity between two herbivore diets.

Sorenson’s index =

Sorenson's index formula 2 × number (no.) of shared plant species 2 × no. of shared species + no. species for animal 1 only + no. species for animal 2 only