Oxygen Circulation Simulator
Simulator Outputs
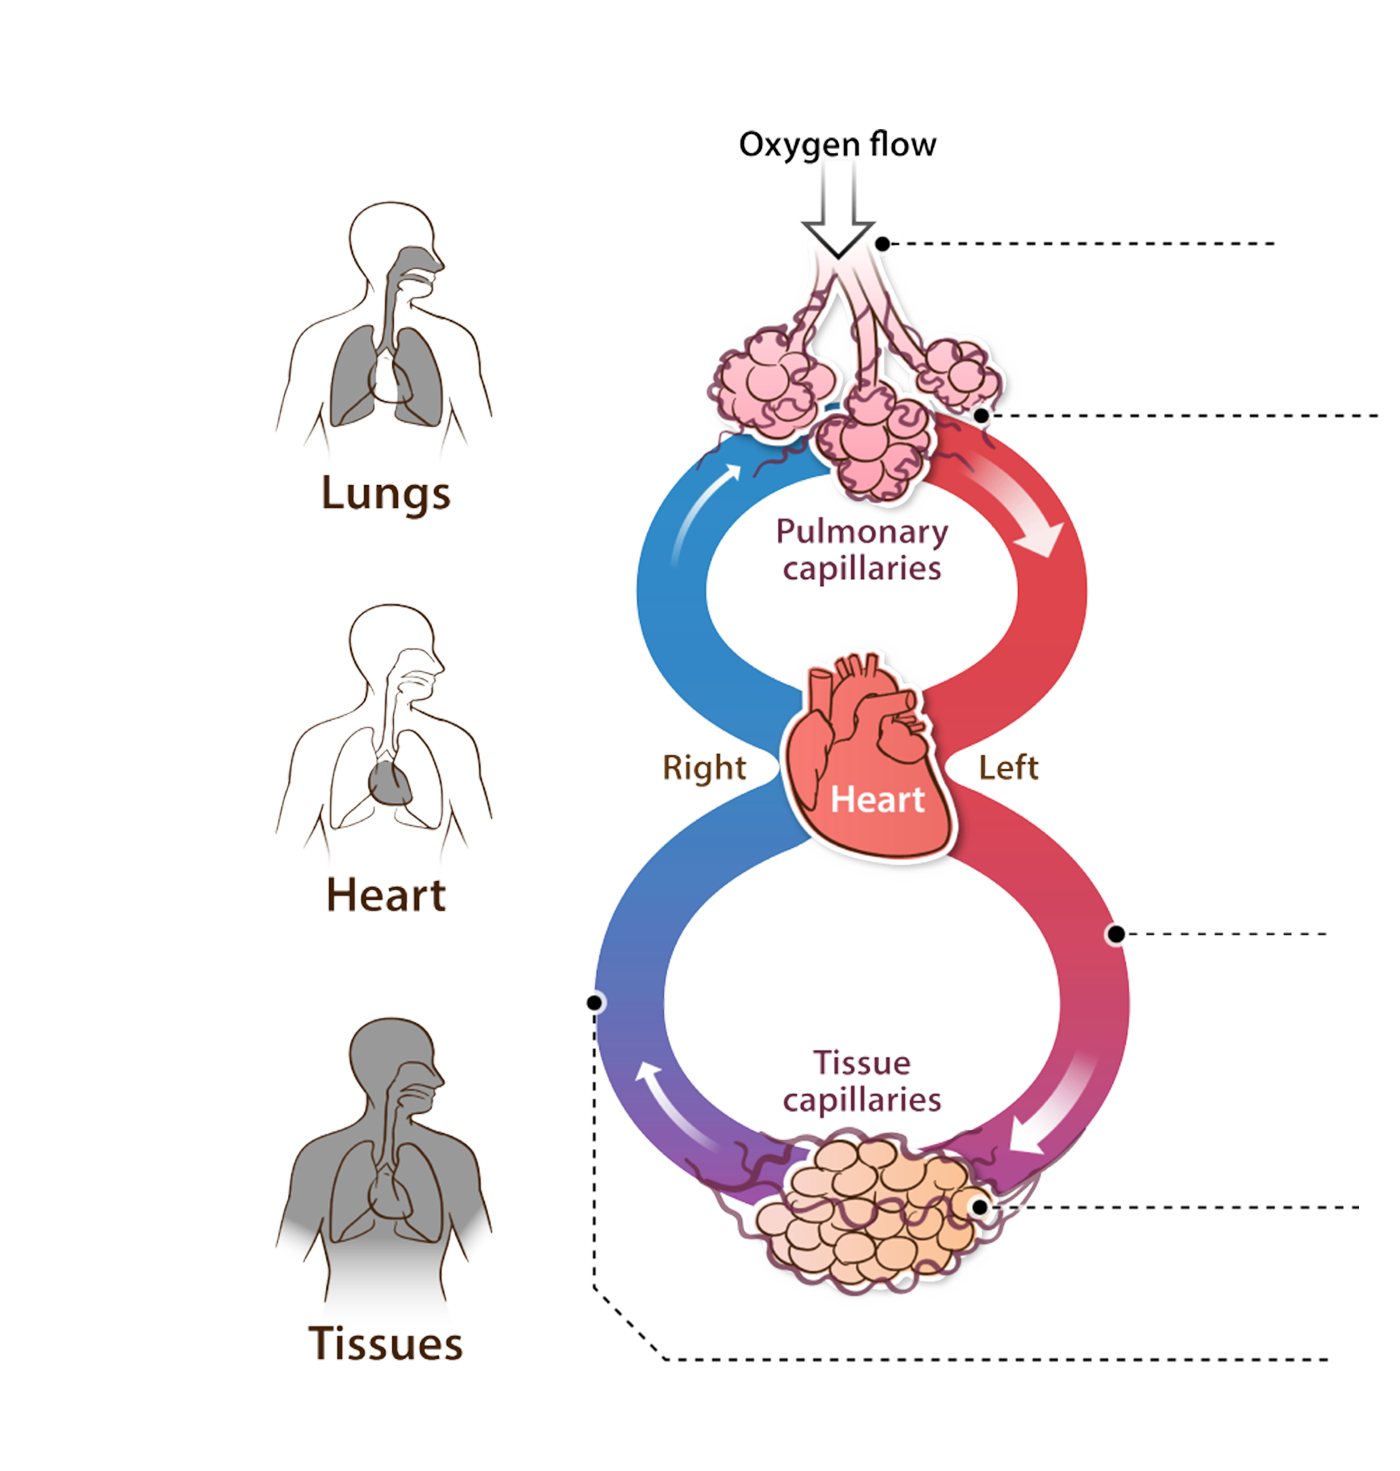
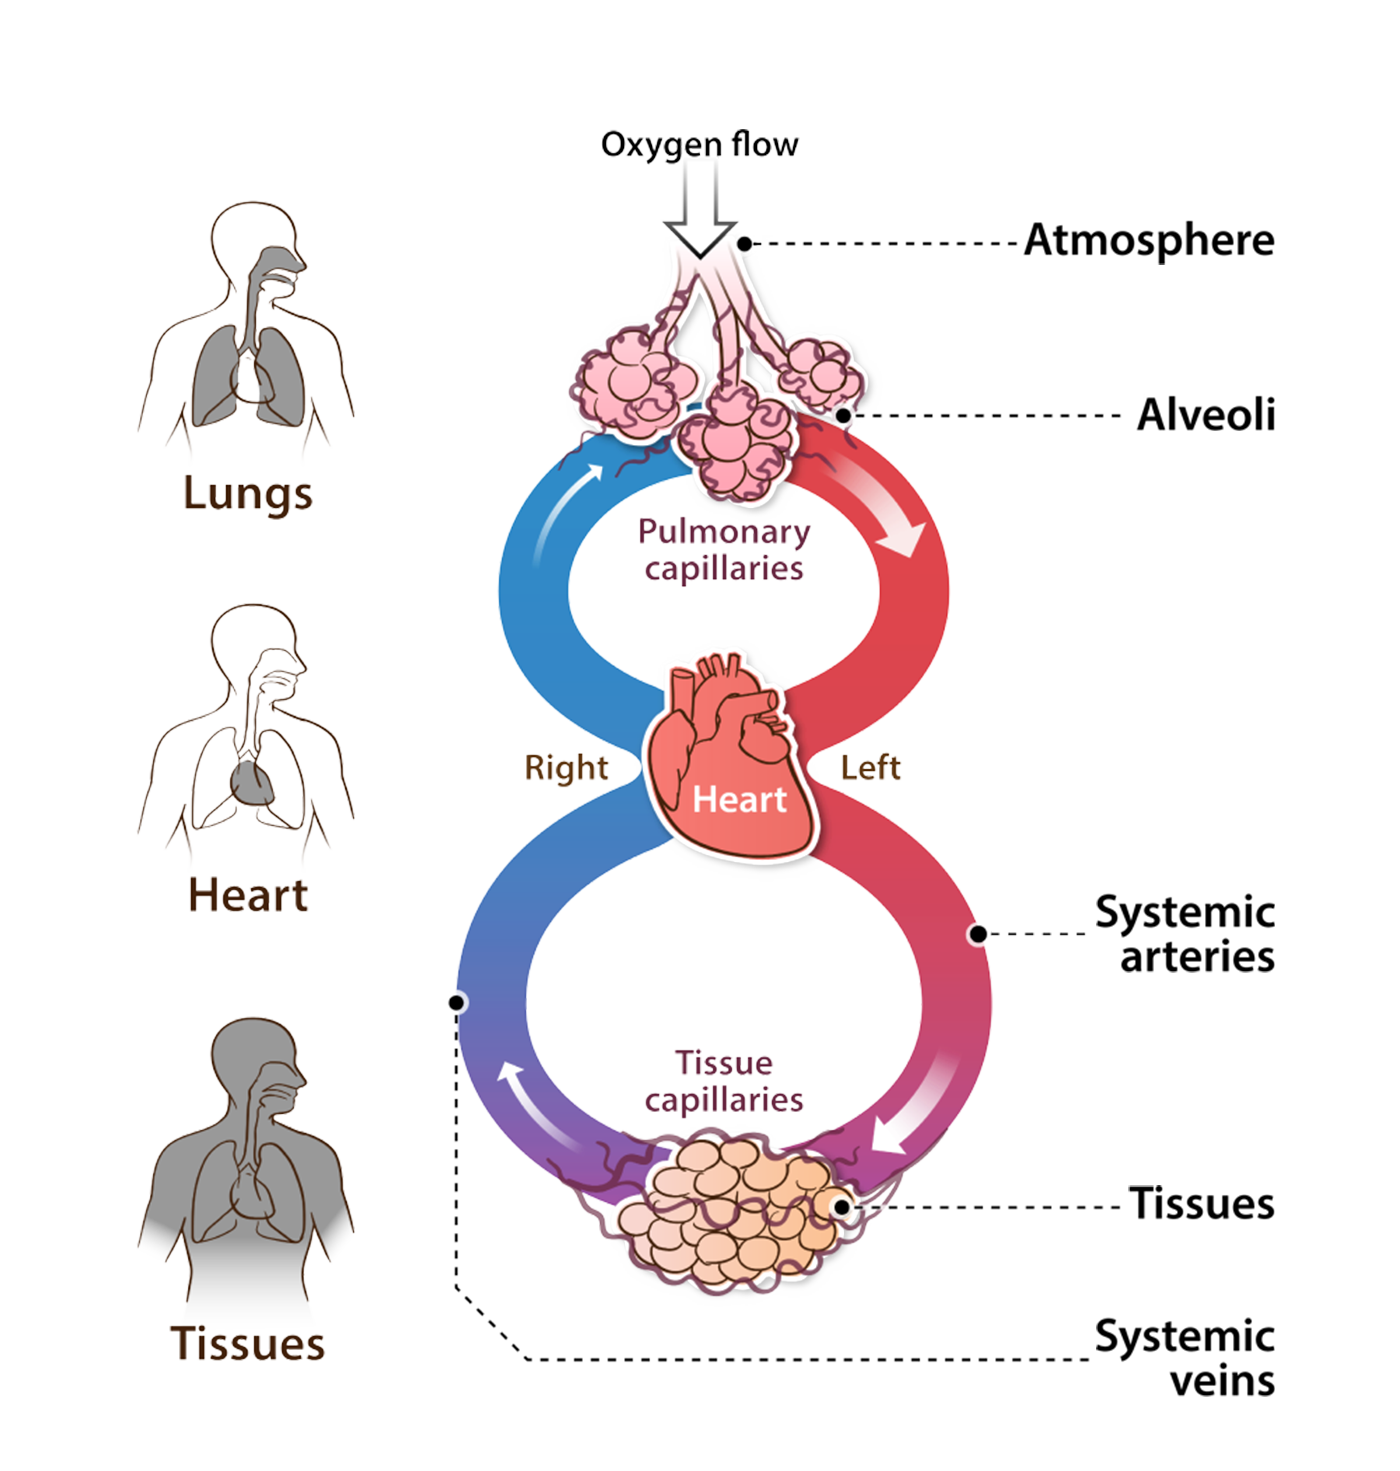
A diagram showing oxygen flow from the atmosphere into the alveoli. A red arrow leads from the alveoli through the pulmonary capillaries to the heart and a blue arrow leads from the heart through the pulmonary capillaries back to the alveoli. A second red arrow leads from the heart through the systemic arteries to the tissues and a second blue arrow leads from the tissues through the tissue capillaries back to the heart. Three illustrated cross-sections of a human torso appear to the left of the diagram. The top-most torso has the nose, mouth, throat and lungs shaded in gray and is labeled Lungs. The middle torso has the heart shaded in gray and is labeled Heart. The bottom torso is completely shaded gray and is labeled Tissues.
The percentage of total hemoglobin binding sites occupied with oxygen.
97.6%, Current Oxygen Saturation
Oxygen Saturation Ranges
≤85% , Dangerous
85% – 90% , Low
90% – 95% , Concerning
95% – 100% , Typical
Graph of Oxygen Flow
The partial pressure of oxygen found in air, which is affected by elevation. Normal range is 160 mmHg at sea level to 53 mmHg at the top of Mount Everest (8,849 m). Also affected by the percentage of oxygen in the inhaled air.
The partial pressure of oxygen in the alveoli. Can range from around 100 to 126 mmHg at sea level depending on environmental and physiological factors. It is also affected by all of the simulator settings.
The partial pressure of oxygen in blood that is pumped away from the lungs. Normally around 101 mmHg at sea level but can be affected by all of the simulator settings.
The partial pressure of oxygen in tissues made up of cells where oxygen is consumed. Normally about 42 mmHg but can be affected by all of the simulator settings.
The partial pressure of oxygen in the blood that is carried from the tissues back towards the heart and lungs. Normally around 43 mmHg but can be affected by all of the simulator settings.
Graphs of the partial pressure of oxygen (PO2) based on the current settings. PO2 values based on the default settings are shown as black vertical lines.