Oxygen in the Body:
Summary
As you’ve learned, differences in pressure help move oxygen from the air to cells. This graph shows the PO2 at several points in this process.
Definition placeholder.
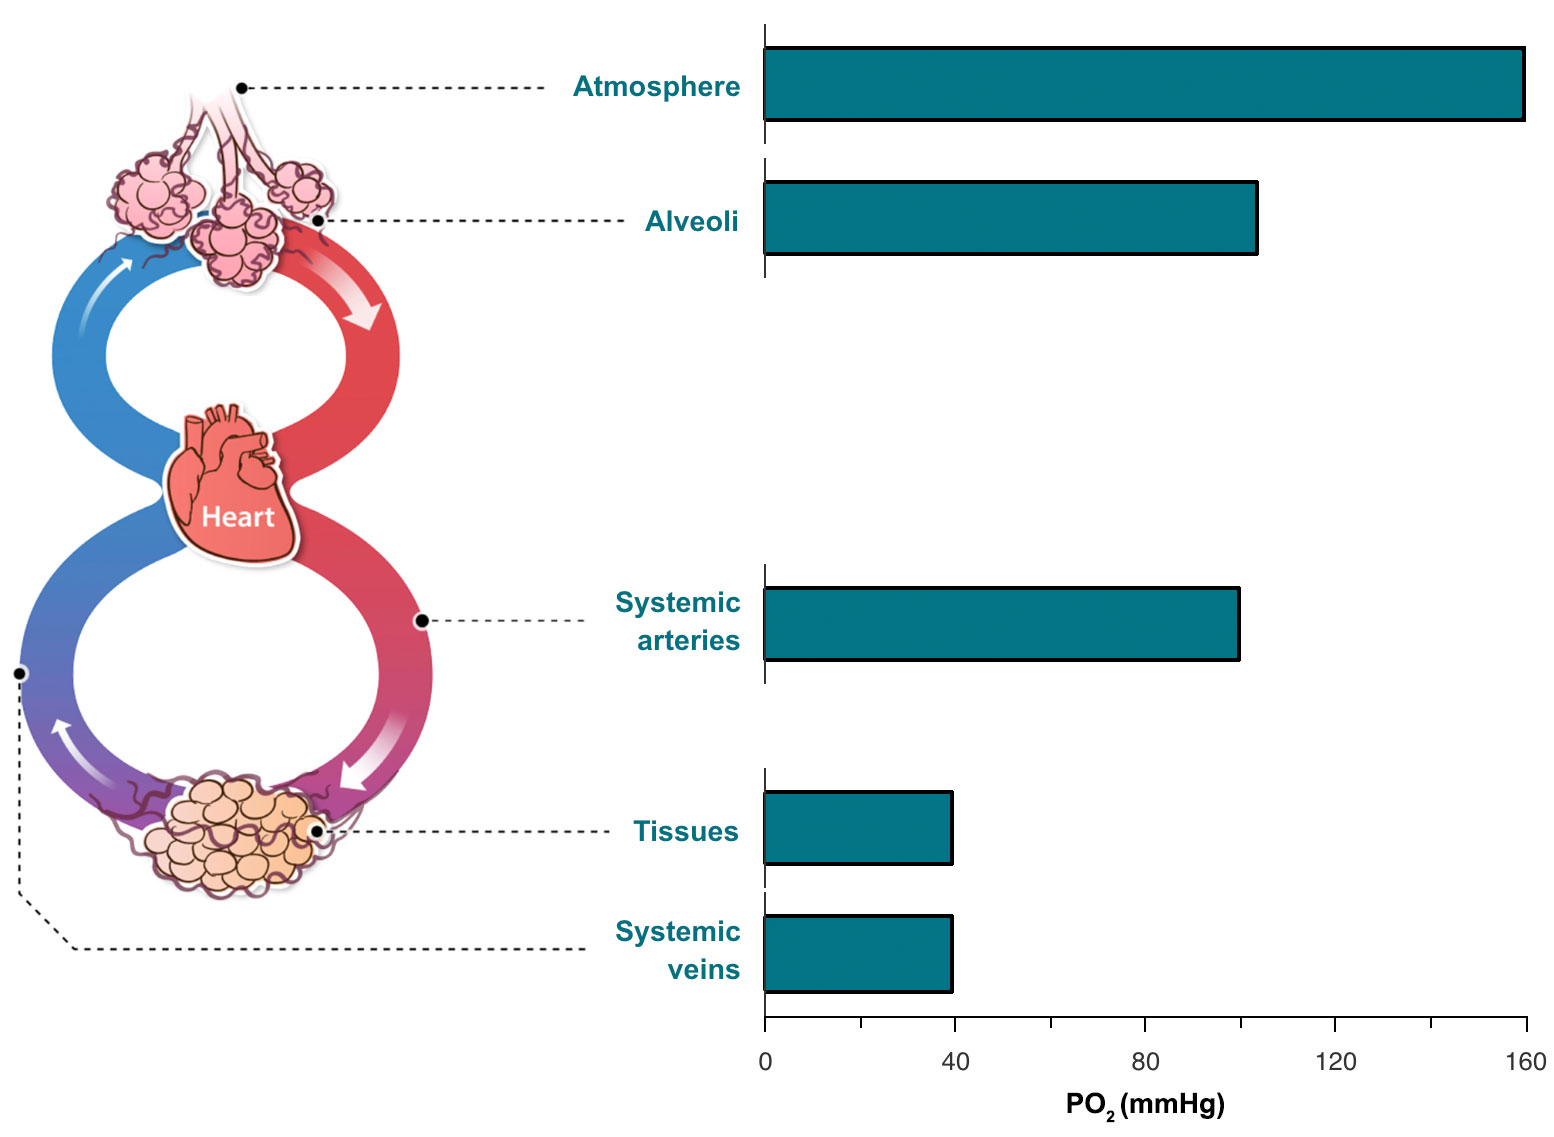
A diagram showing oxygen moving from the atmosphere into the alveoli. A red arrow leads from the alveoli to the heart and a blue arrow leads from the heart back to the alveoli. A second red arrow leads from the heart through the systemic arteries to the tissues and a second blue arrow leads from the tissues through the systemic veins back to the heart. A bar graph shows the partial oxygen pressure of the various parts of the diagram. The partial oxygen pressure of the atmosphere is 160, the alveoli is 104, the systemic arteries is 100, and the tissues and systemic veins are 40.
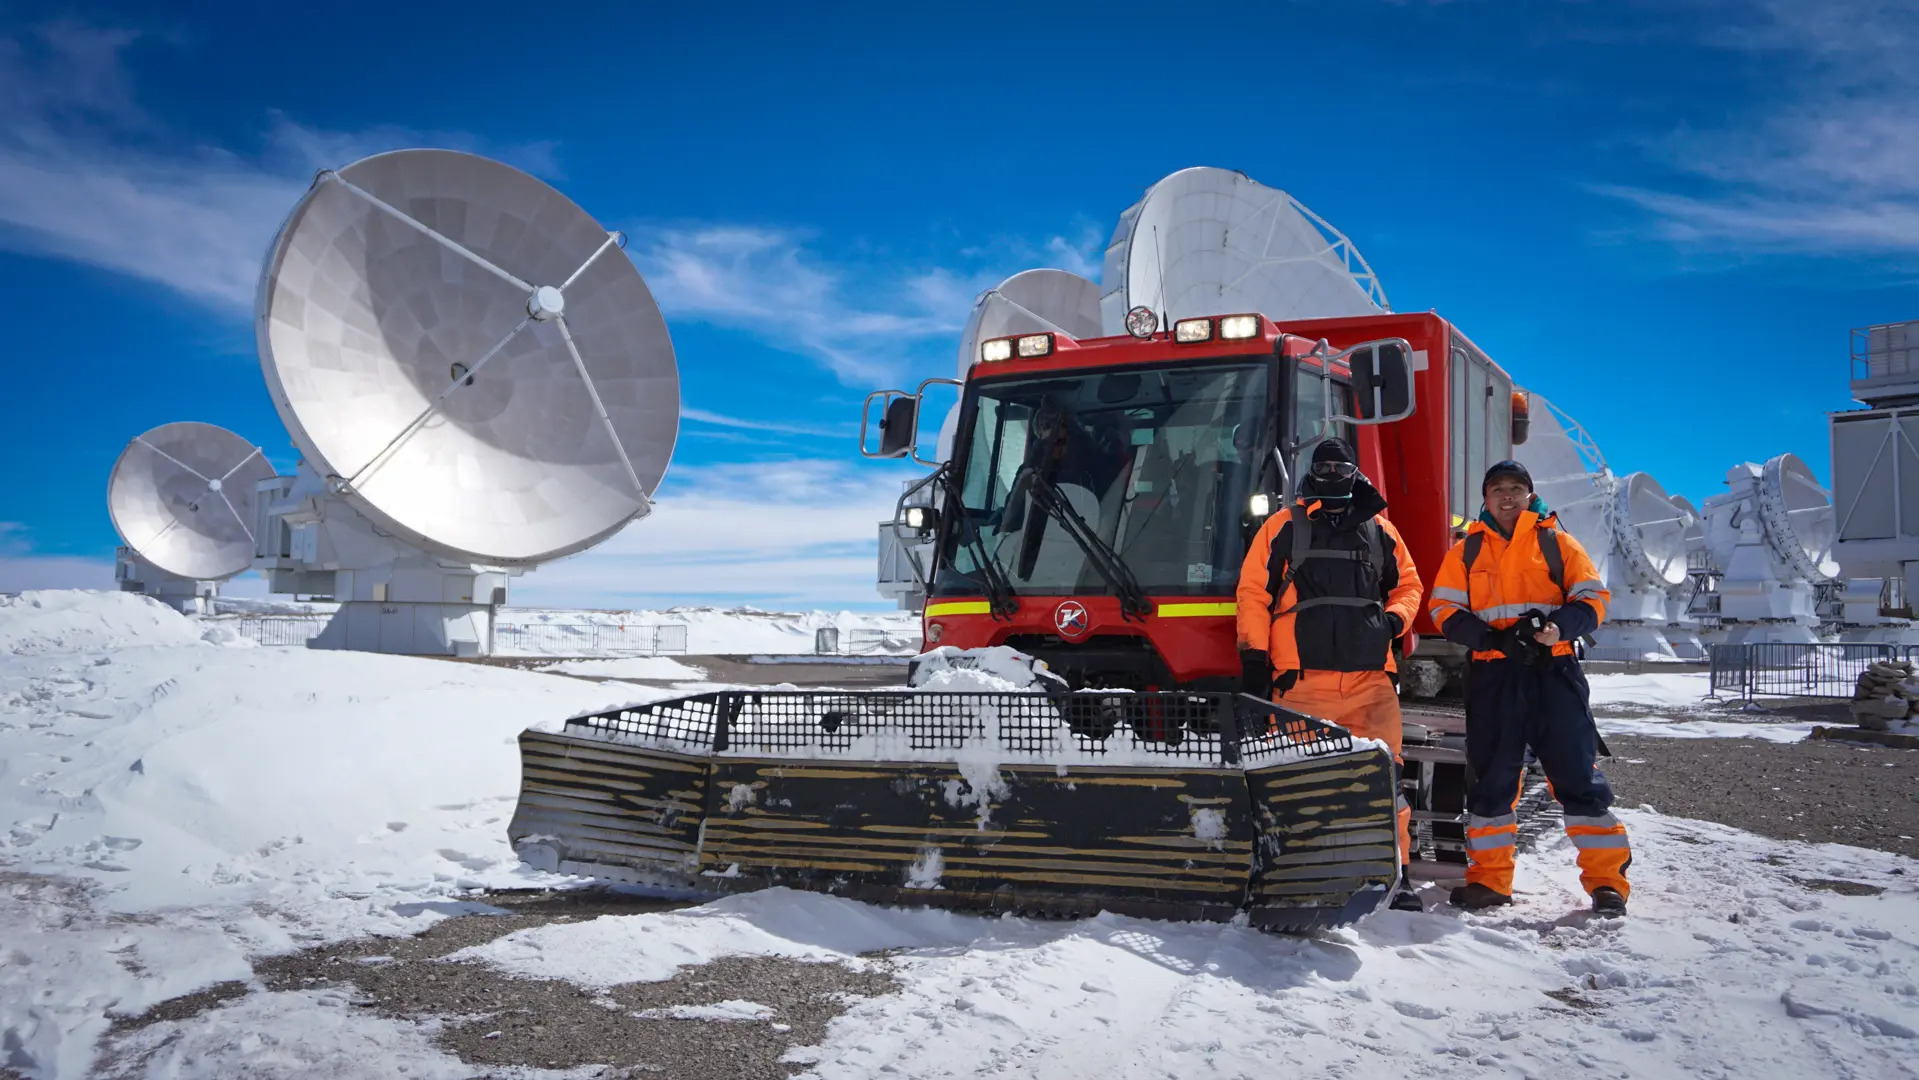
Many variables affect this system. What if a person goes to another elevation, where the atmospheric pressure is different? What if they start breathing faster or deeper? How does the body adjust — and how do those adjustments help people who work at or travel to high elevations, such as the people working on the ALMA antenna array?
Use the “Oxygen Circulation Simulator” in the next tab to explore a model of this dynamic system.