Atmospheric CO2 Over the Past 20,000 Years (Part 2)

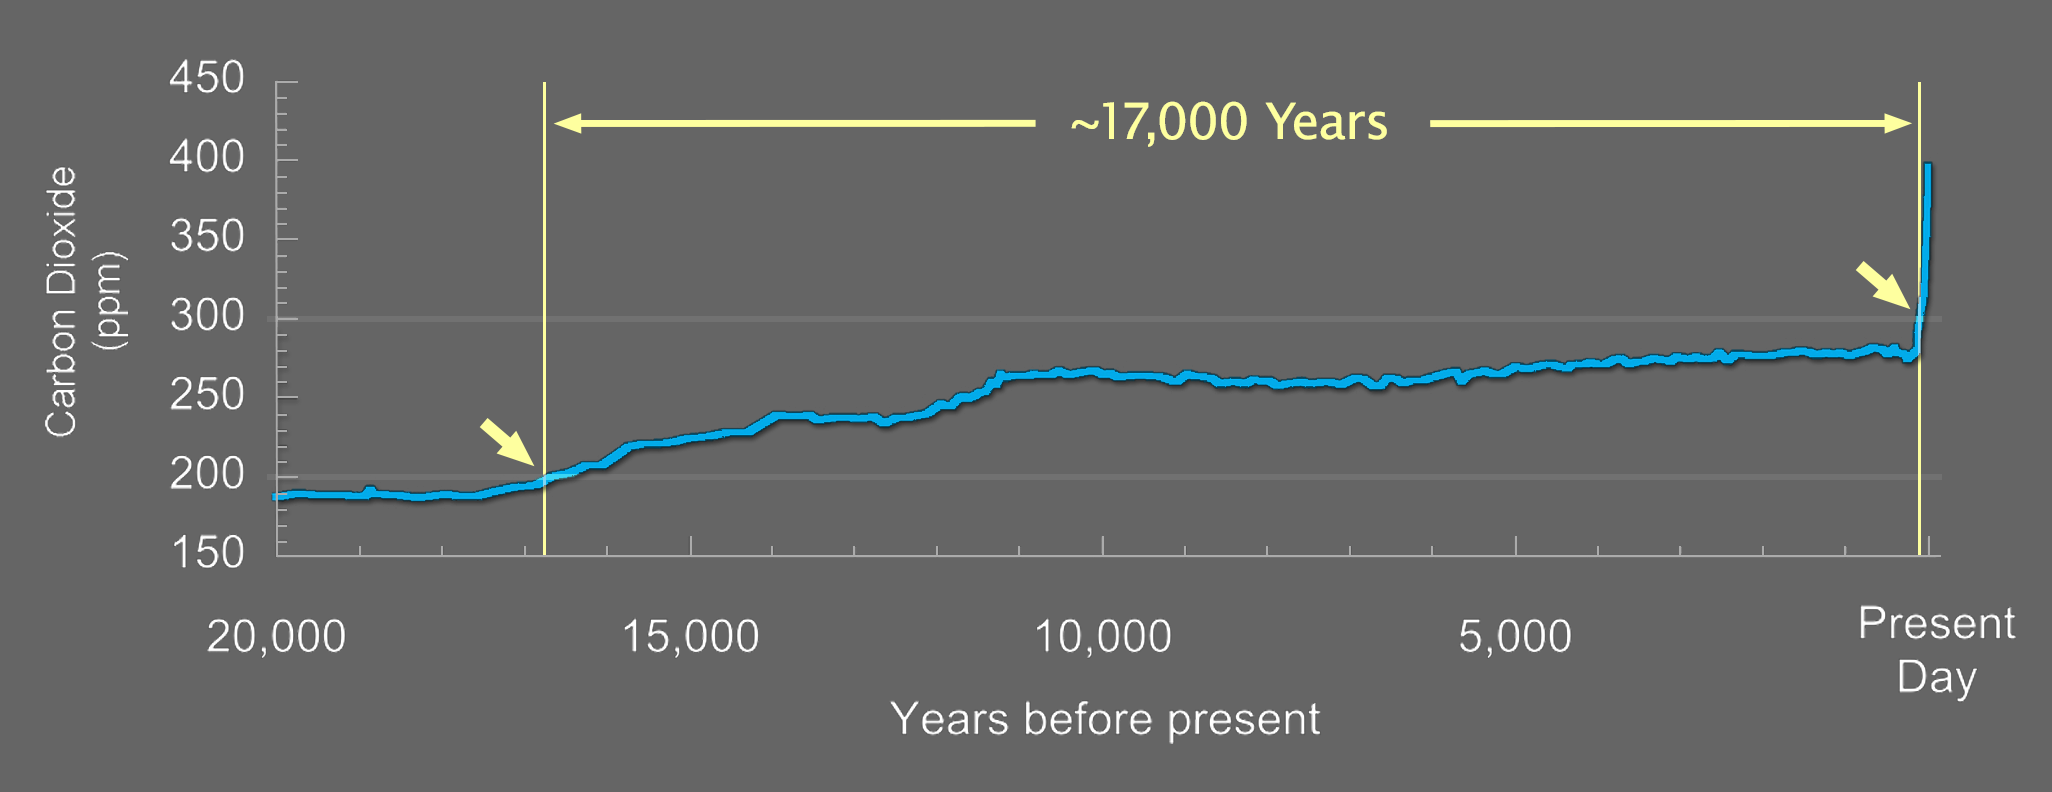
It took almost 17,000 years for CO2 to go from 200 to 300 ppm.

Now looking at the graph, estimate the time it took to go from 300 to 400 ppm.

The same graph as in the previous slide showing carbon dioxide in parts per million from 20,000 years before present to the present day. Two vertical lines, one at around 17,000 years ago with an arrow marking where the graph crosses the 200 mark and another at around present day with an arrow marking where the graph crosses the 300 mark. A horizontal two-sided arrow along the top spans from one vertical line to the other and is labeled approximately 17,000 years.
Atmospheric carbon dioxide (ppm) over the past 20,000 years.