Acoustic Surveys
ELP researchers first studied forest elephants in Dzanga National Park in the Central African Republic to determine the calling rate, or the number of calls elephants make in a given time period. They set up six audio recorders around the edge of a forest clearing and observed elephants from a platform, recording the number of elephants visible in the clearing (see figure below). The six audio recorders simultaneously recorded the elephant sounds, and researchers triangulated the location where each call came from to determine whether it came from inside or outside of the clearing. They then matched the data with the number of elephants observed to calculate the calling rate. This allowed the researchers to estimate the number of elephants in any location in a forest elephant habitat, based solely on the number of calls recorded. They also determined that the area in which a single audio recorder can reliably detect elephant calls in this habitat is 3.22 km2, which represented the sampling area around each recorder. The sampling area must be adjusted for each study based on the amount of background noise present in that habitat.
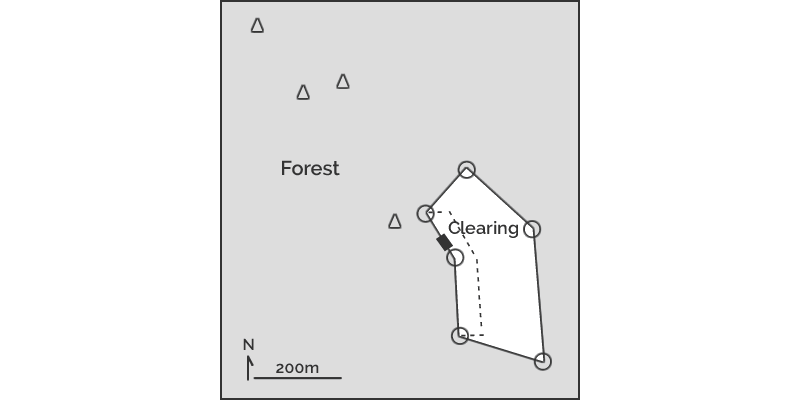
The white area is a forest clearing and the gray area is forest. Circles are audio recorders around the clearing, triangles are audio recorders in the forest, and the black rectangle is the viewing platform. Source: Thompson et al., 2009
ELP researchers then conducted a survey in Kakum Conservation Area, Ghana, using the calling rate model they developed in Dzanga National Park to estimate elephant population size in this forest. They set up nine audio recorders at random points within the forest and recorded simultaneously for 38 days (see figure below). They counted the number of elephant calls recorded during 20-minute sampling periods at each location. The sampling periods were 4 hours apart from one another to reduce the chance of counting the same elephants. Based on the higher background noise level at the study site, the sampling area of each recorder was estimated as 1.14 km2. Finally, they multiplied the elephant abundance within the sampling areas by the area not covered by the recorders to get the total estimated elephant population in Kakum Conservation Area.
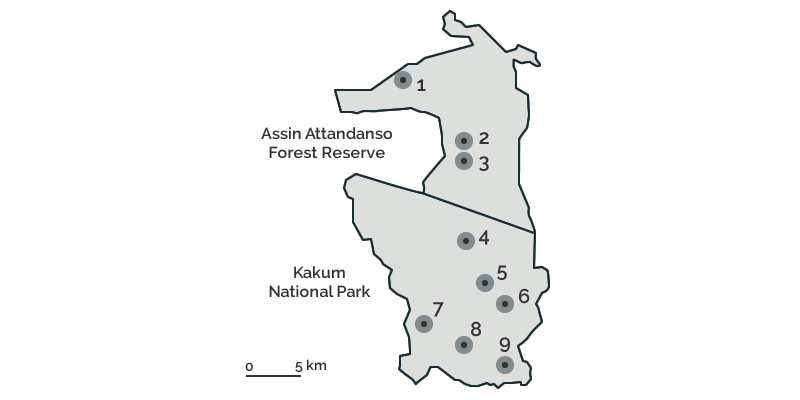
The light gray area is Kakum Conservation Area. The numbered points are the locations of the audio recorders and the dark gray rings around the points are the sampling areas of the recorders. Source: Thompson et al., 2009