Population growth rates of protozoa
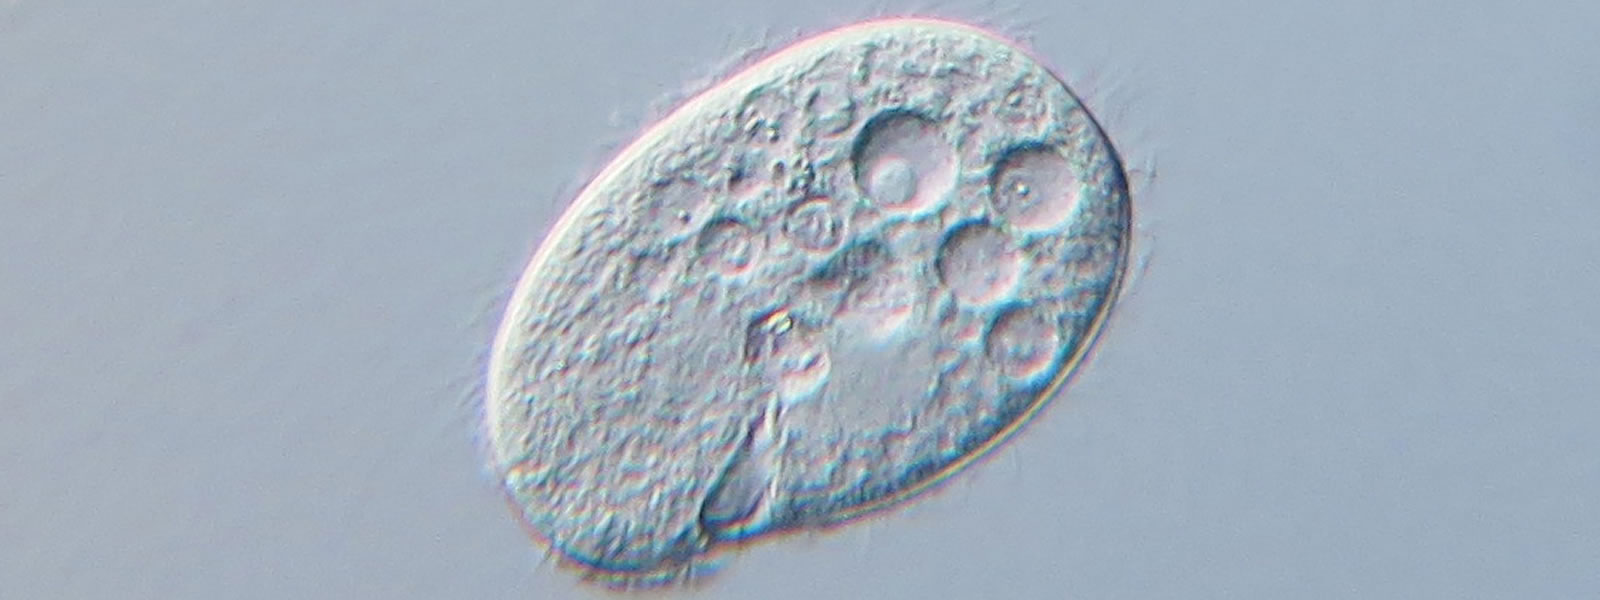
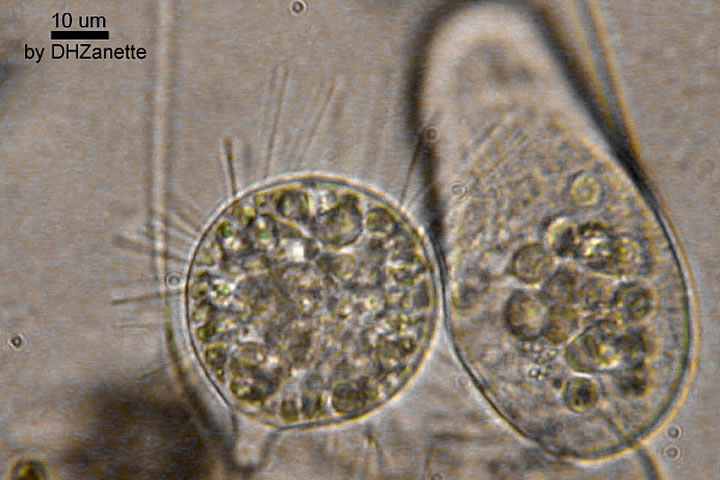
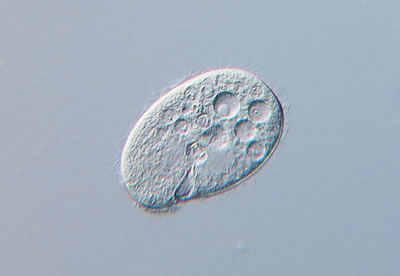
This study investigated population dynamics in Colpidium protozoa, single-celled organisms that live in freshwater environments and eat bacteria. Holdridge and colleagues (2016) grew groups of protozoa at four different initial densities. After three days, they measured the final densities to calculate the realized per capita population growth rate () for each group.
The scientists also wanted to know how the population growth rate at a given density is affected by resource availability. So, they studied the four densities of protozoa under two different conditions: high and low resource availability. Protozoa under the “high resource availability” condition got about four times as much food (bacteria that grew on dried bloodworms) as protozoa under the “low resource availability” condition did.
The effect of initial density and resource (food) availability on the realized per capita population growth rate () of Colpidium protozoa
was calculated by subtracting the initial cell density from the final cell density, then dividing that difference by the initial cell density.

The High resource availability bar graph has an x axis labeled Initial density in cells per milliliter which ranges from 0 to 250 in increments of 50. The y axis is labeled Realized per capita growth rate and ranges from 0 to 20 in increments of 5. The first bar measures an initial density of 25 cells per milliliter and 18 realized per capita growth rate. The second bar measures 75 cells per milliliter and 9 realized per capita growth rate. The third bar measures 125 cells per milliliter and 6 realized per capita growth rate. The forth and final bar measures 275 cells per milliliter and 3 realized per capita growth rate. The Low resource availability graph has the same x and y axes. The first bar measures an initial density of 25 cells per milliliter and 6 realized per capita growth rate. The second bar measures 75 cells per milliliter and 3 realized per capita growth rate. The third bar measures 125 cells per milliliter and 2 realized per capita growth rate. The forth and final bar measures 275 cells per milliliter and 1 realized per capita growth rate.
Use what you've learned above to answer the following questions: