Productivity
The rate at which an ecosystem accumulates energy or generates biomass is known as productivity. Locations with high productivity have more energy available at the base of the food chain. So they can also support more biomass at higher levels of the food chain.
Productivity can be measured in units of mass per area per time—for example, grams of carbon (C) produced per square meter (m-2) per year (yr-1).
Gross productivity is the rate at which energy is obtained or captured — for example, the rate at which producers capture light energy and convert it into chemical energy through photosynthesis. Net productivity is the rate at which energy is converted into biomass specifically.
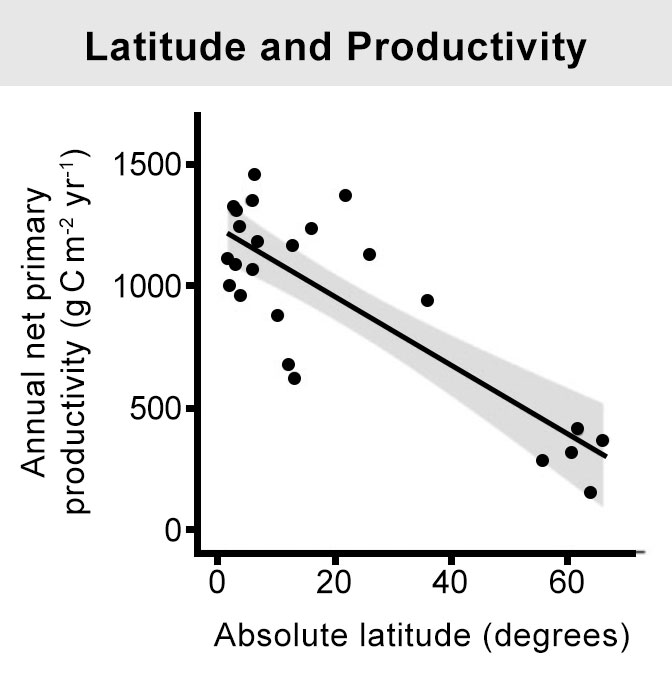
At lower latitudes, 0 to 20 degrees, the productivity values range from 500 to 1500 grams of carbon per square meter per year. At higher latitudes, about 60 degrees, the productivity ranges from 200 to 500 grams of carbon per square meter per year. The graph shows a regression line fitting the data that slopes from high productivity at low latitudes to low productivity at high latitudes. A shaded area around the line shows the 95% confidence interval for the regression.