Photosynthetically Active Radiation
This graph shows the relative rate of photosynthesis that occurs at different wavelengths of PAR, which can be seen as different colors of light. The peaks indicate the wavelengths where light energy is more efficiently absorbed by chloroplasts: cellular structures that certain producers (plants and algae) use for photosynthesis.
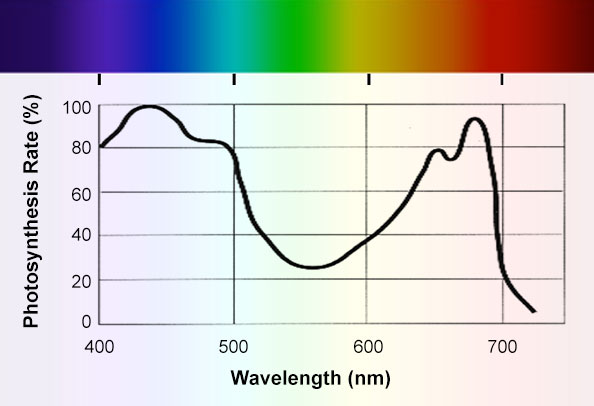
For wavelengths between 400 to 500 nanometers corresponding to the color blue, photosynthesis rates vary between 80 to 100 percent.
For wavelengths between 500 to 600 nanomaters corresponding to the color green, photosynthesis rates vary between 25 to 80 percent.
For wavelengths between 600 to 700 nanomaters corresponding to the color orange, photosynthesis rates vary between 40 to 90 percent.
For wavelengths above 700 nanomaters corresponding to the color red, photosynthesis rates fall below 20 percent.