Latitudinal Variation

Different latitudes on Earth receive different amounts of solar energy. Throughout a year, on average:

  • Locations at low latitudes (near the equator) receive more consistent amounts of energy.
  • Locations at high latitudes (far from the equator) receive more variable amounts of energy. Some places go from constant daylight to constant night at different times of year.

The amount of solar energy received also varies with season. In June, July, and August, compared to other months of the year:

  • Locations in the northern hemisphere receive more energy.
  • Locations in the southern hemisphere receive less energy.

Question 2

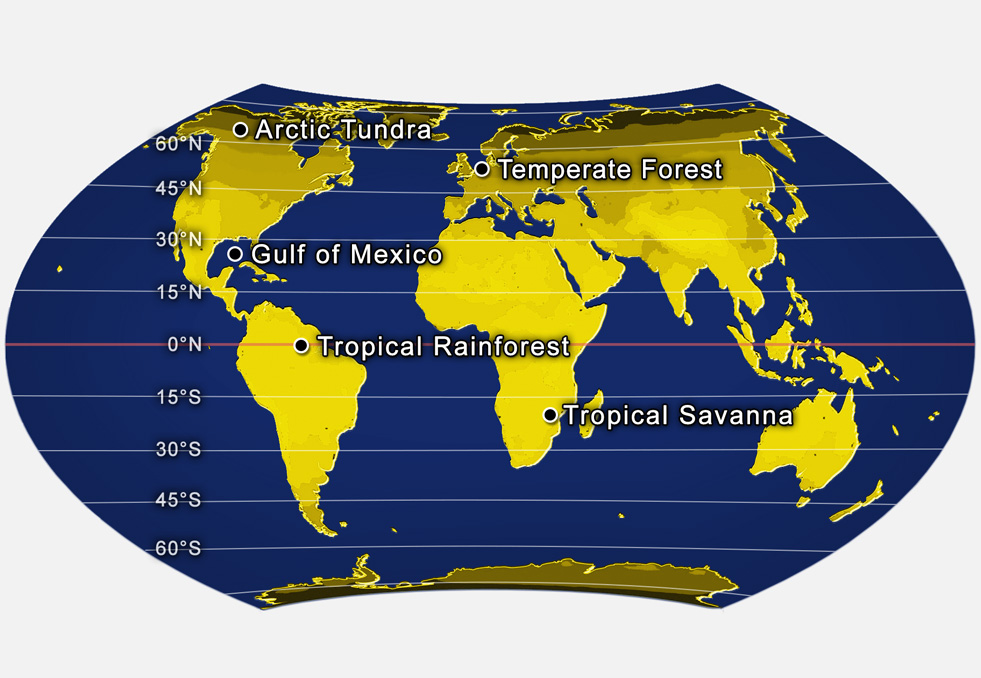
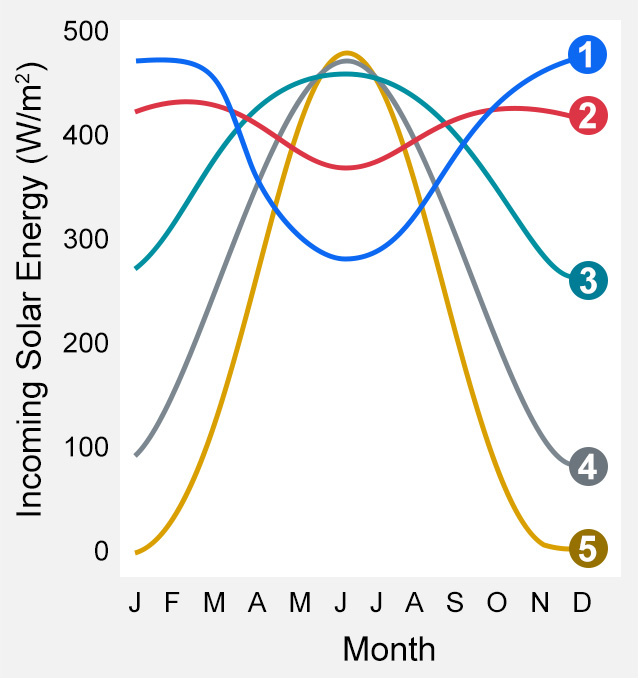
Examine the map and graph. The map shows five locations at different latitudes. The graph shows five lines, each representing the flux of solar energy received by one location over a year. Use the dropdown menu buttons to select the map locations that correspond to the numbered lines on the graph.

A map of Earth with 5 locations plotted.
A map of Earth with five locations labeled. The locations are: arctic tundra (latitude 69 degrees north), tropical savanna (latitude 19 degrees south), Gulf of Mexico (latitude 25 degrees north), temperate forest (latitude 51 degrees north), and tropical rainforest (latitude 1 degree south).
A graph showing monthly energy entering the atmosphere at five locations.
The flux of incoming solar energy (energy entering Earth’s atmosphere) at five locations over a year. The x-axis shows months and the y-axis shows incoming solar energy in watts per square meter. There are five lines on the graph labeled 1 through 5. Lines 1 and 2 are u-shaped with their highest values in January and then again in December. Their lowest values are in July. Line 1 has higher and lower extremes. Lines 3, 4, and 5 are gentle peaks that have about the same maximum energy in July. Of the three, line 3 starts and ends the highest, followed by line 4. Line 5 starts and ends the lowest.
Your answers: