Interpreting Microarray Data: Understanding the Ratios
Keeping in mind that each dot on the microarray corresponds to a gene, what do the numbers tell us?
When the ratio is greater than one, the gene was induced (stimulated to make more mRNA) by tumor formation. Gene A was induced fourfold.
When the ratio is less than one, the gene was repressed (to make less mRNA) by tumor formation. Gene C was repressed threefold.
Tumor formation did not affect Genes B and D.
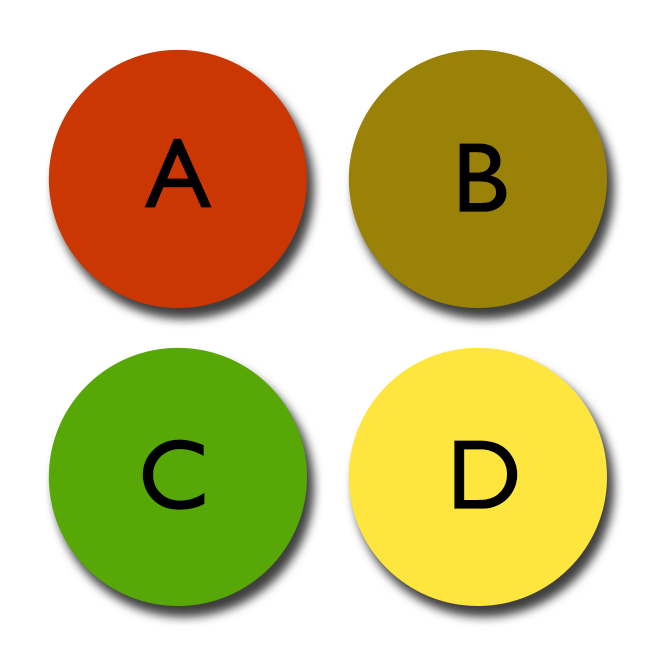
| Gene A | Gene B | Gene C | Gene D | |
|---|---|---|---|---|
| Red (tumor) | 400 | 200 | 100 | 400 |
| Green (normal) | 100 | 200 | 300 | 400 |
| Ratio Red/Green | 4 | 1 | 0.33 | 1 |