But Some Patients Relapsed

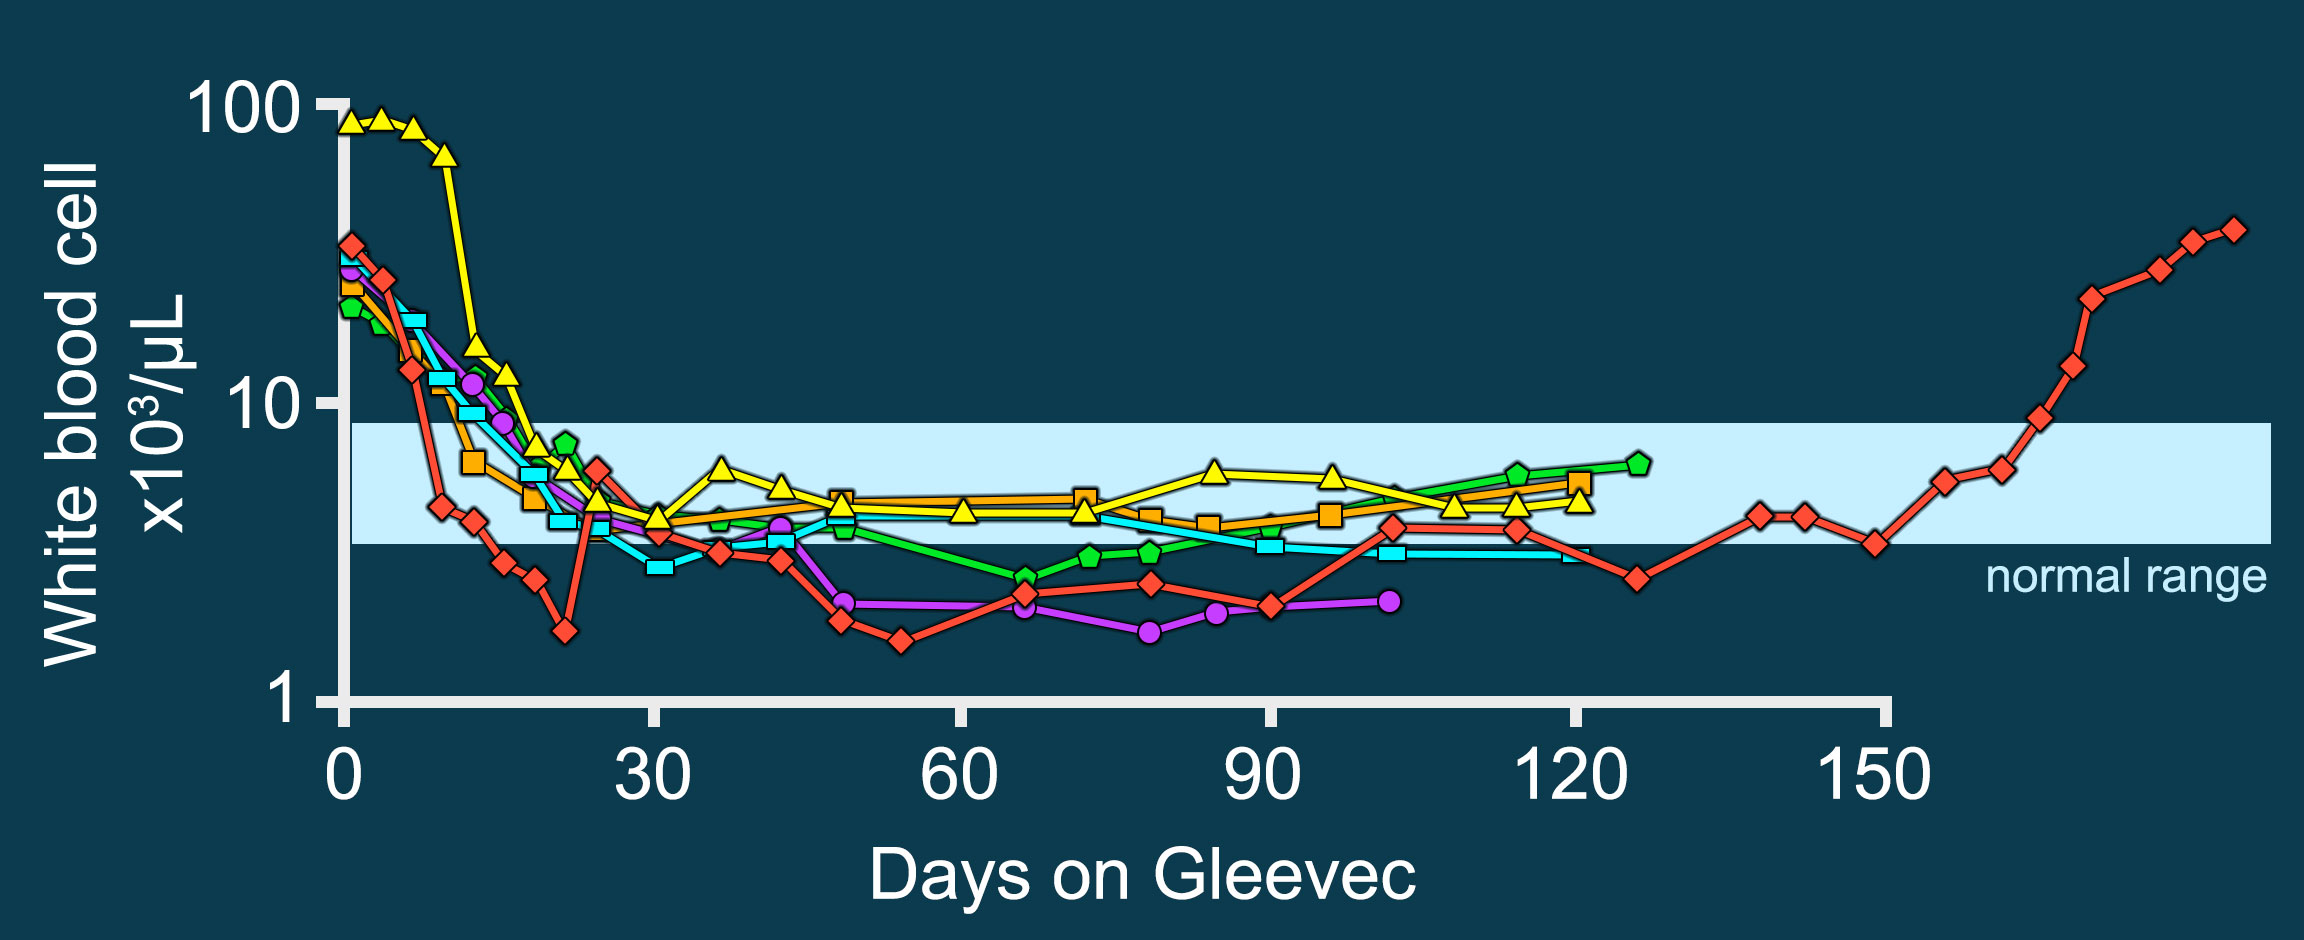
After several months on Gleevec the white blood cell counts of some patients started to increase. One such patient (red line) is shown in this graph.

Was the BCR-ABL kinase no longer inhibited in this patient?

A line graph with 6 different colored lines representing 6 patients. X axis is labeled Days on Gleevec with values ranging from 0 to 150 in increments of 30 days. Y axis is labeled White Blood cell times 10 to the third microliters with values ranging from 1 to 100. A horizontal band labeled normal range highlights 5 to 10 from the Y-axis and extends the width of the graph. All patient data starts above normal range, between 10 and 100, at zero days, then drops to normal or below normal range by 30 days, and then plateaus.  The red line shows an increase in white blood cells after 150 days and eventually returns to its above normal value from day 0.
Six different patients with CML and on the drug Gleevec