How Effective Was Gleevec Against Cancer? (Continued)
The colored lines show the white blood cell counts of six different patients with CML. They all show a decrease in response to Gleevec. These results suggested the treatment was working.
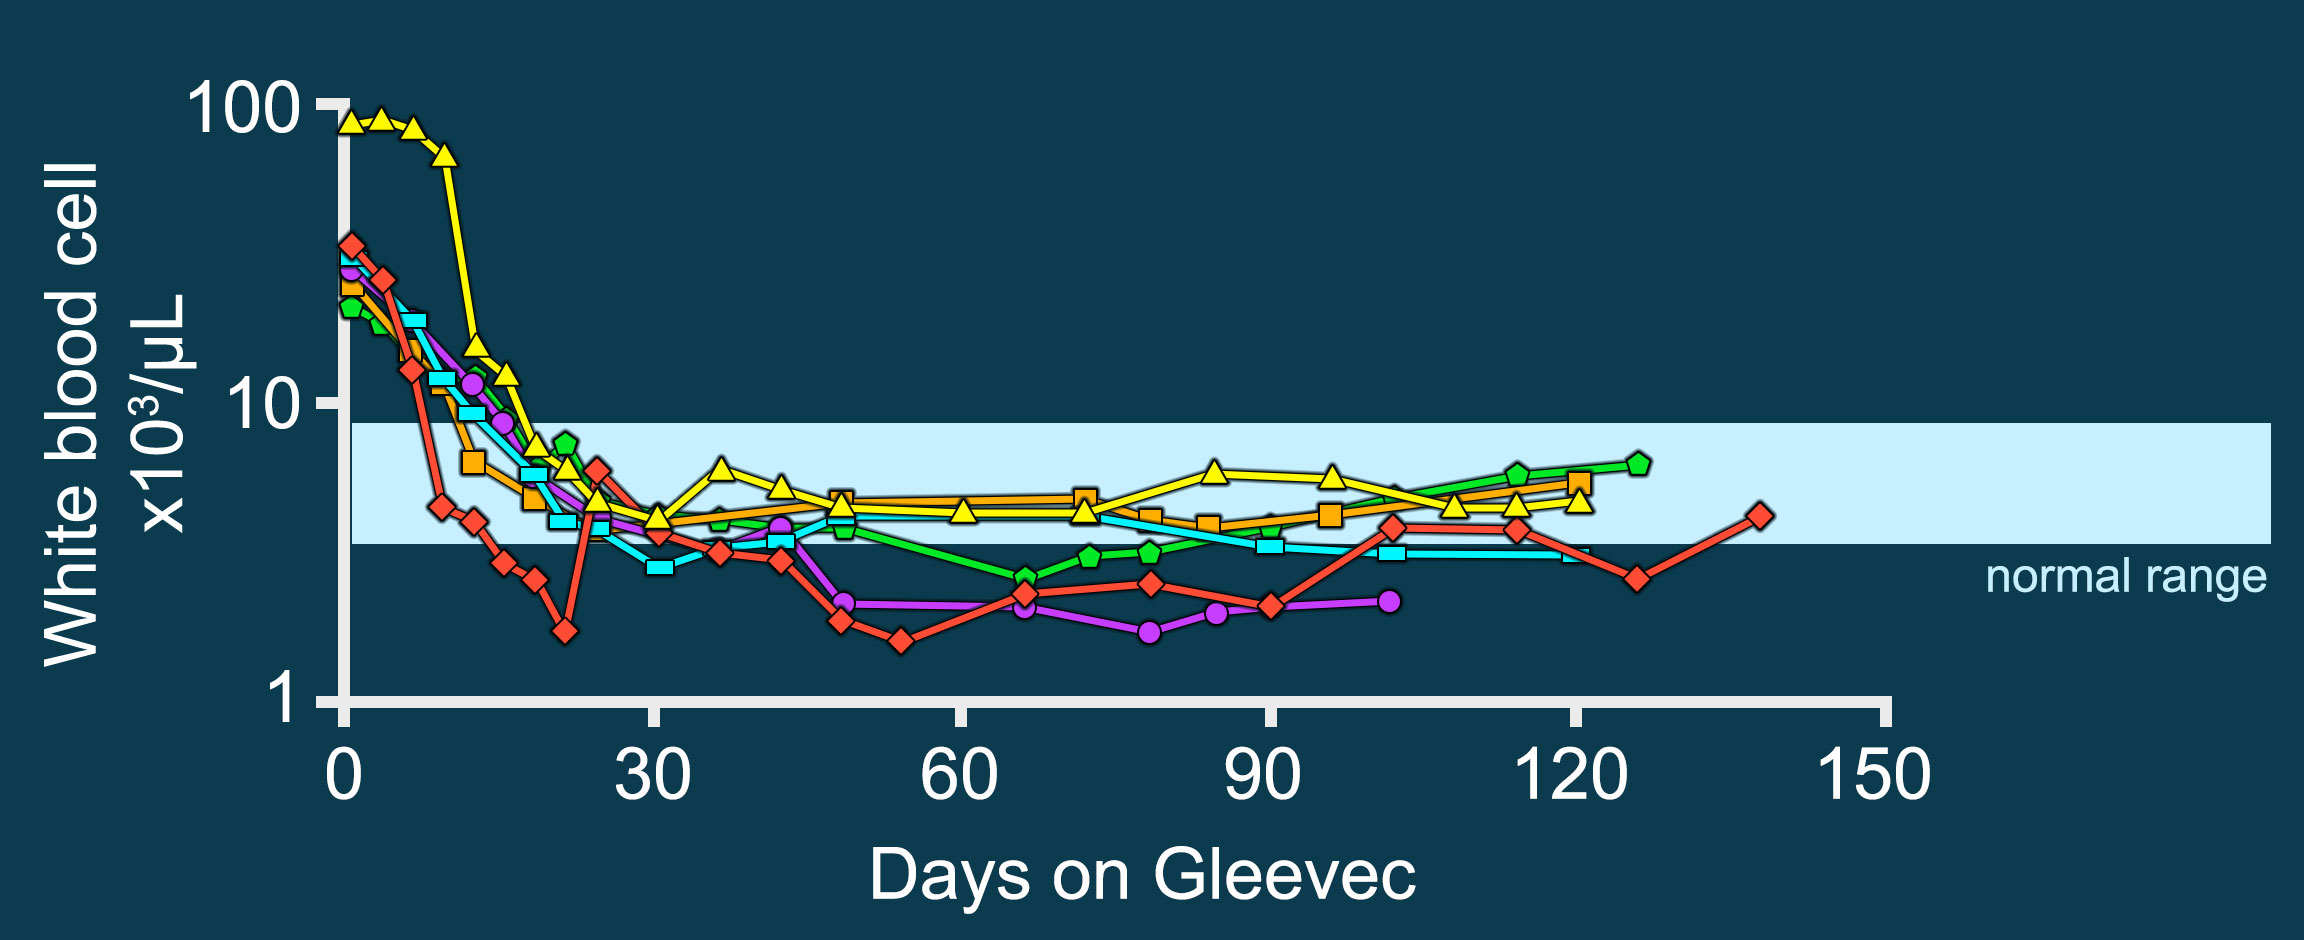
The colored lines show the white blood cell counts of six different patients with CML. They all show a decrease in response to Gleevec. These results suggested the treatment was working.