Experiment 3: Graph Analysis
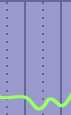
Mouse over (or tap) the peaks and troughs of the graph to display the
corresponding times. Record the peak and trough times in the table below
the chart. When you are finished recording,
Note: you may
leave this window open to refer to your analysis when taking the quiz.
If you close this window, you will lose your data. Printing this window
is recommended.
 |
 |
||||||||||||||||||
 |
 |
 |
 |
 |
 |
 |
 |
 |
 |
 |
 |
 |
 |
 |
 |
 |
 |
 |
|
 |
|
||||||||||||||||||
 |
|
||||||||||||||||||
 |
|
||||||||||||||||||
 |
|
||||||||||||||||||
 |
|
||||||||||||||||||
 |
 |
|
|||||||||||||||||
 |
|
||||||||||||||||||
 |
|
||||||||||||||||||
 |
 |
|
|||||||||||||||||
 |
 |
|
|||||||||||||||||
 |
|
||||||||||||||||||
 |
 |
 |
 |
|
|||||||||||||||
 |
|
||||||||||||||||||
 |
 |
|
|||||||||||||||||
 |
 |
 |
 |
|
|||||||||||||||
 |
|
||||||||||||||||||
 |
|
||||||||||||||||||
 |
|
||||||||||||||||||
|
|
|
|
|
| |||||||||
Normal 12-hours-light/12-hours-dark schedule:
| |||||||||
|
|
| ||||||||||||||||||
Dark-dark schedule: Lights off | ||||||||||||||||||
|
|
| ||||||||||||
Altered light-dark schedule: Daytime is noon — midnight | ||||||||||||
|