Stickleback Evolution Lab Progress |

|
Experiment 1: Quiz Results
1. What conclusion can you draw from your graph in Experiment 1?
- The graph indicates that Bear Paw Lake has more fish than Frog Lake.
- The data suggest that fish in Bear Paw Lake are bigger than those in Frog Lake.
- The graph suggests that all fish in Bear Paw Lake lack pelvic spines and all fish in Frog Lake have pelvic spines.
- The data suggest that the fish in Frog Lake vary widely in pelvic structures.
Why?
The graph shows data on pelvic scores in the same number of fish from two different lakes. (It does not provide any information about the sizes of fish.) According to the graph, all fish in Bear Paw Lake have absent or reduced pelvic phenotypes, which means they have no pelvic spines. All fish in Frog Lake have complete scores, which means they possess pelvic spines.
2. In this experiment, you examined only 20 fish from each lake. In 1990, Dr. Michael Bell and colleagues examined 210 fish from Bear Paw Lake and 192 fish from Frog Lake. They found that 100% of sticklebacks in Frog Lake had a complete phenotype. Most sticklebacks from Bear Paw Lake had a reduced phenotype and the rest an absent phenotype. Are your results consistent with Dr. Bell's?
| Your Pelvic Structure Score Totals | |||||
|
|
|
|
|||
| Complete: | |||||
| Reduced: | |||||
| Absent: | |||||
- Yes
- No
- Not sure
Why?
All the sticklebacks from Frog Lake should have a complete pelvis. In Bear Paw Lake, most of your sticklebacks should have had a reduced pelvis and none of them a complete pelvis.
3. Based on what you have learned so far about threespine stickleback fish, which of the following statements is most accurate:
- The stickleback population in Bear Paw Lake is more similar to marine and sea-run stickleback populations in terms of pelvic morphology than it is to the Frog Lake stickleback population.
- The stickleback populations in Bear Paw Lake and Frog Lake are both freshwater populations; thus, they are more similar to one another in pelvic morphology than they are to marine and sea-run stickleback populations.
- The stickleback population in Frog Lake is more similar to marine and sea-run stickleback populations in terms of pelvic morphology than it is to the Bear Paw Lake stickleback population.
- There is a lot of variation in pelvic morphology within each population of threespine stickleback fish.
Why?
The reduced pelvic phenotypes have never been observed in marine and sea-run populations; the pelvic spines protect marine and sea-run sticklebacks from larger fish that prey on them in the ocean. Most stickleback in Bear Paw Lake have either a reduced or absent pelvis, while those in Frog Lake have a complete pelvis. There is little variation within each population, and the stickleback in Frog Lake are more similar to marine and sea-run stickleback.
4. Bear Paw Lake and Frog Lake were likely populated by the same sea-run population of stickleback at the end of the last ice age. Which of the following statements is the most reasonable explanation for what might have happened to the stickleback in each lake since colonization?
- Over many generations, stickleback in Bear Paw Lake have lost their pelvic spines, while those in Frog Lake have retained full pelvises.
- Over many generations the pelvic structures in Bear Paw Lake stickleback have remained the same, and the stickleback in Frog Lake have gained their pelvic spines.
- Stickleback in Frog Lake will lose their pelvic spines before the next ice age.
- The ancestral marine population of stickleback must have lacked pelvic spines.
Why?
We know that all marine and sea-run stickleback populations have a complete pelvis with pelvic spines. When sea-run stickleback colonized freshwater lakes, some of the populations changed dramatically. Because stickleback in Bear Paw Lake lack pelvic spines, we can infer that over time, the sea-run stickleback that founded this population evolved a reduced pelvis. In contrast, the pelvises in stickleback from Frog Lake still look like those of sea-run stickleback, and thus, we can infer that this trait was retained.
5. It takes energy and resources for a stickleback to develop spines. Thus, over time pelvic spines would not be retained in stickleback populations
unless they provide some kind of selective advantage. Using this knowledge, would you agree with the following statement: "In Bear Paw Lake having pelvic
spines does not seem to provide the same selective advantage as it does to stickleback living in the ocean."
- Agree
- Disagree
Why?
Stickleback in the Bear Paw Lake population have evolved a reduced or absent pelvis in the last 10,000 to 20,000 years. From this observation,
we can infer that having spines does not provide a significant survival advantage to stickleback in Bear Paw Lake as it does to stickleback in
the ocean, and/or that the cost of producing spines is much greater in Bear Paw Lake than it is in the ocean. Thus, over many generations the
trait has been lost from the Bear Paw Lake stickleback population. We know that Bear Paw Lake has different predators from the ocean. In
addition, fresh water is not as rich in calcium and other minerals needed to form pelvic spines.
6. One of the functions of pelvic spines in the ocean is to protect stickleback from larger fish predators. Based on this knowledge, which statement might be a possible explanation for the differences in pelvic spines between Bear Paw Lake and Frog Lake sticklebacks?
- Frog Lake has no native predatory fishes such as trout.
- Frog Lake likely has native predatory fishes, but they do not prey on stickleback fish.
- The food webs that characterize organisms in Bear Paw Lake and Frog Lake are virtually identical.
- Bear Paw Lake has no native predatory fishes.
Why?
Frog Lake has native predatory fish, such as the trout, that have probably been there since ancestral, sea-run stickleback colonized this lake. All the fish in Frog Lake have a complete pelvis. Unlike Frog Lake, Bear Paw Lake historically did not have native predatory fishes. There are different predators in Bear Paw Lake. Dragonfly larvae are thought to grab stickleback pelvic spines to catch the fish and then eat them. Thus, having spines might actually be a liability in an environment like Bear Paw Lake.
7. Like Bear Paw Lake, nearby Kalmbach Lake is an Alaskan lake that historically had no native predatory fish. The Alaska Department of Fish and Game started introducing rainbow trout into Kalmbach Lake in 1982. Prior to these introductions, pelvic reduction was common in this stickleback population. The rainbow trout is known to prey on stickleback. What would you hypothesize has happened to the stickleback population in the more than 30 generations that have elapsed since the trout was introduced?
- All the stickleback fish in Kalmbach Lake perished.
- The population size of stickleback fish dropped dramatically, leaving only a few survivors, all of which have the absent pelvic phenotype.
- Most stickleback fish in Kalmbach Lake now have pelvic spines.
- Kalmbach Lake has no native predatory fishes.
Why?
Many stickleback in Kalmbach Lake had reduced pelvises because the lake originally did not have native predatory fishes. The introduction of rainbow trout provided a selective advantage to any stickleback with pelvic spines. That means those with a complete pelvis were more likely to survive, reproduce, and pass on their genes to the next generation. As a result, fish with a complete pelvis became more and more common in Kalmbach Lake over the years. Today, most stickleback in this lake have pelvic spines.
Experiment 2: Quiz Results
1. Which statement below best represents the relationship between age and position of sediment layers in the Nevada lake quarry?
- The top layer of sediment was the first to be deposited, and therefore, it must be the oldest.
- The oldest layer analyzed from this ancient lake occurs in the middle of the strata as a consequence of uplift due to an earthquake roughly 10 million years ago.
- The lowest layer of sediment is the oldest.
- Of the six layers of fossils analyzed, we only know that the top layer is the youngest because layers below it were deposited randomly without any systematic pattern.
Why?
Each rock layer represents sediment that was deposited year after year, and today the layers are stacked one on top of the other. The oldest layer is at the bottom and the youngest layer is on top.
2. What can we infer from the stickleback fossil record about evolutionary processes occurring today?
- Evolutionary patterns observed in the fossil record are consistent with evolutionary processes occurring today.
- The fossil record provides insights into the ecological mechanisms that result in the evolution of pelvic reduction, while study of living populations tells us more about the rate of evolutionary change of this trait.
- Analysis of the fossil record indicates that natural selection was an evolutionary process at work in the past but it no longer occurs today.
- Analysis of fossil stickleback shows us that threespine stickleback living millions of years ago looked strikingly different from those living today.
Why?
In both the ancient lake that is now the Truckee Formation and modern lakes, some stickleback populations went from having complete pelvises with spines to having reduced or absent pelvises. Study of modern populations (i.e., comparisons of existing populations with and without native predatory fishes) reveals ecological mechanisms, while investigations of the fossil record tell us more about change over time. From the fossil record, we can learn about the rate of evolutionary change of pelvic structures.
3. Why was it appropriate to use a line graph to summarize the results from this experiment?
- Line graphs are used to compare characteristics of organisms from different populations at a single point in time.
- A line graph is the only type of graph with both dependent and independent variables.
- A line graph is the only type of graph that can include time as one of the variables.
- Line graphs are used to represent continuous data.
Why?
In Experiment 1, it was appropriate to graph the data using a bar graph because you were comparing traits in two populations at the same snapshot in time. If you want to see how these traits changed in a single population over time, a line graph is more appropriate, with the independent variable (x-axis) being time.
4. Which statement below best describes what happened to the stickleback population in the ancient lake that is now the Truckee Formation?
- The frequencies of reduced and complete pelvic phenotypes fluctuate from layer to layer, but overall, there is no trend in gain or loss of either trait in the population.
- Initially, the stickleback population in the lake consisted mostly of fish with pelvic spines, but over 15,000 years the population changed to fish without pelvic spines.
- Initially, very few fossil stickleback sampled had the complete pelvic phenotype, but in the following 15,000 years, the frequency of this phenotype in the population increased significantly.
- The frequencies of absent and reduced pelvic phenotypes are roughly equal throughout the 15,000-year time span studied because the lake became flooded at one point, which allowed trout to enter the lake from other areas.
Why?
In layers 1 and 2 (the oldest layers), most fossil stickleback have a complete pelvis, which means they had pelvic spines. In layers 5 and 6 (the youngest or more recent layers), virtually none of the stickleback fossils examined had a complete pelvis. This means that, in this ancient lake, the frequency of stickleback with pelvic spines decreased over time.
5. Studies of living stickleback populations indicate that pelvic spines are an effective defense against large predatory fish such as trout. What can we infer based on the data from Experiment 2?
- The lake in Nevada was initially populated by stickleback that had complete pelvises, and because the lake did not contain large predatory fish, the frequency of stickleback with pelvic spines decreased over time.
- The lake in Nevada was initially populated by stickleback without pelvic spines, and because the lake had no large predatory fish, the frequency of stickleback with pelvic spines increased over time.
- The lake in Nevada was initially populated by stickleback fish with complete pelvises, and because the lake was already inhabited by large predatory fish, the frequency of stickleback with pelvic spines decreased rapidly.
- The lake in Nevada was originally populated by stickleback with pelvic spines, but large predatory fishes outcompeted these stickleback for food, which almost drove the stickleback population to extinction.
Why?
We know from the graph that in layers 1 and 2 (the oldest layers), most fossil stickleback had pelvic spines. Over time, their frequency decreased until there were virtually no stickleback with pelvic spines. This suggests that pelvic spines imposed a selective disadvantage compared to the reduced or absent phenotypes, which means that there probably were no large predatory fish in the lake. Also, predatory fishes are more likely to prey on stickleback rather than outcompete them for food.
6. How would you test whether the ancient Nevada lake contained predatory fish?
- You can't. You can only test for predatory fish in modern lakes.
- You could look for fossils of other fish in the rocks that contain stickleback fossils.
- You could look at modern lakes in Nevada to see what kinds of fish they contain. You can then assume that the same fish were present in the ancient lake.
- You could look for traces of bite marks just on the soft tissue in all the fossil stickleback studied.
Why?
If there were large predatory fish in the ancient lake, one should be able to find their fossils. Dr. Michael A. Bell and colleagues have found fossils of other fishes in the quarry, but most of them were small species that could not eat sticklebacks. Fossils of larger fish species, including two trout and one catfish specimens, were very rare compared to the tens of thousands of fossil stickleback present. The kinds of fish in modern Nevada lakes are likely to be very different from those in the lake 10 million years ago because the climate and environment were very different then compared to now (i.e., the area that was once a lake is now a desert). Lastly, soft tissue (i.e., organs, muscle) is rarely, if ever, preserved during fossilization of vertebrates.
7. Living populations tell us about mechanisms of selection; fossils provide a record of change over time. Based on what you have learned so far in this virtual lab, would you agree or disagree with this statement?
- Agree
- Disagree
Why?
Studying modern stickleback populations gives us insight into the selection pressures acting on the stickleback pelvis. For example, the presence of pelvic spines is correlated with the presence of large predatory fish, which suggests that stickleback use the pelvic spines for defense against predatory fish. However, research on modern populations is limited to relatively short stretches of time; even 100 years is a short time when it comes to evolution. The fossil record allows one to observe changes that occur over tens of thousands of years.
Experiment 3: Quiz Results
1. Which of the following statements best describes the results from Experiment 3?
| Answer to Pelvic Asymmetry Score Totals | |||||||||
|
|
|
|
|
|||||
| Coyote Lake | 20 | 0 | 100% | 0% | |||||
| Bear Paw Lake | 18 | 2 | 90% | 10% | |||||
- In Coyote Lake, most fish with reduced pelvises have a vestige that is larger on the left than on the right, whereas most fish in Bear Paw Lake do not show any bias.
- Most or all fish in both lakes have a pelvic vestige that is larger on the right than on the left.
- Most or all fish in both lakes have a pelvic vestige that is larger on the left than on the right.
- Most fish could not be scored one way or another because a bias was not apparent.
Why?
Most or all fish in Bear Paw Lake and Coyote Lake have a pelvic vestige that is larger on the left than on the right (i.e., left-biased pelvic asymmetry).
2. Dr. Michael A. Bell and colleagues studied fish in 27 lakes in the Cook Inlet region and recorded the relative frequencies of specimens with pelvic asymmetry. Their results are summarized in the graph below. Which of the following statements best describes the data?
- In the first three lakes (abbreviated O, L, CV), there are more fish with a pelvic vestige that is larger on the right than on the left. In all but one of the other lakes, more fish have a pelvic vestige that is larger on the left than right.
- In the first three lakes (O, L, CV), more fish have a pelvic vestige that is larger on the left than on the right. In one lake, there is no bias in pelvic asymmetry. In all other lakes, more fish have a reduced pelvis that is larger on the right than on the left.
- Only Bear Paw Lake (BP) and Coyote Lake (Co) have fish with pelvic vestiges that are larger on the left than on the right.
- The results from Bear Paw Lake (BP) and Coyote Lake (Co) stickleback obtained in this experiment of the virtual lab are completely different from those presented in the graph for these populations.

The graph above shows relative frequencies (expressed as percentages) of fish with reduced bilaterally asymmetrical pelvic skeletons. The unshaded bars represent stickleback with a larger vestige on the left. Shaded bars represent those with a right bias. Each abbreviation represents a different lake population. All but three lakes (abbreviated O, Br S, and Ti) have fish with both left and right bias–that's why the graph has two bars for all lakes except for those three. This graph was adapted from one published in Bell, M. A., Khalef, V., and Travis M. P. Directional asymmetry of pelvic vestiges in threespine stickleback. J. Exp. Zool. 308B: 189-199 (2007).
Why?
The shaded bars represent the percentage of fish with reduced pelvises that have a larger vestige on the right than on the left. Thus, in the first three lakes (abbreviated O, L, and CV), fish with right-biased pelvic reduction are more numerous. Dolomite Lake (D) has an equal number of fish with left bias and right bias. Each of the other lakes has more fish with a left bias, as indicated by the higher unshaded bar compared to the shaded bar. These results should be in general agreement with the results you graphed in Part 3 of this experiment.
3. In the study described in the previous question, Dr. Bell examined more than 100 fish per lake population. When you compare the results you obtained for Bear Paw Lake and Coyote Lake to the results Dr. Bell obtained in the same two lakes, you may find your numbers to be slightly different. What might be a reasonable explanation for the difference?
- When different people conduct the same experiment, the results are going to be different.
- There might be a difference in results due to a sampling error. In this experiment, you only examined 20 fish, and they might not have been entirely representative of the population.
- Dr. Bell's study did not examine fish from these two lakes.
- Dr. Bell examined more than 100 fish. By analyzing so many fish, you have a greater chance of making errors. A smaller sample (i.e., 20 fish) would be more representative of the population.
Why?
In this experiment, you only examined 20 fish each in Bear Paw Lake and Coyote Lake. This is still a sufficient sample size in either lake to statistically detect whether there is a difference between the numbers of fish with left bias and right bias. The relative frequencies calculated from a sample size of 20 might not be representative of the population; greater sample error is associated with smaller sample size. Dr. Bell examined more than 100 fish from each lake, and thus, his results are more likely to be representative of the lake populations.
4. The first clue into the genetics of pelvic spine loss in sticklebacks came from researchers working in a different area of science. Those
researchers found that mice genetically engineered to lack the function of the Pitx1 gene did not develop complete hind limbs. The mice without a
functional Pitx1 gene had just the remnants of a pelvis and hind limbs, and what was left of these structures was larger on the left than on the
right side. Since then, researchers have discovered that pelvic reduction in most freshwater stickleback populations is associated with mutations that
inactivate Pitx1 in the pelvis. Based on this knowledge and your findings in this exercise, would you agree or disagree with the following
statement: Left-biased pelvic asymmetry appears to be a signature of the loss of function of the Pitx1 gene.
- Agree
- Disagree
- I am not sure
Why?
The statement accurately summarizes what scientists have discovered. Loss of Pitx1 function is responsible for pelvic reduction in many stickleback populations. A reduced pelvis that is larger on the left is a subtle yet extremely informative associated phenotype of loss of Pitx1 gene expression in both mice and stickleback fish. In a few populations, stickleback have right-biased pelvic asymmetry. Scientists suspect that in these cases, different genetic factors are involved, thus resulting in a slightly different phenotype.
5. The study of fossil stickleback offers the advantage of studying evolutionary rates across geologic time scales, but only living stickleback lend themselves to DNA analysis. Thus, one cannot study the DNA of fossil stickleback to determine the gene or genes associated with a particular phenotype. Dr. Bell has looked for left and right asymmetry in fossil stickleback with reduced pelvises (see one example below). He found that in more than 75% of cases, the pelvic vestiges of these fish are bigger on the left. Which of the following statements might be a plausible conclusion for these findings?
- These studies suggest that the Pitx1 gene was responsible for pelvic spine loss in the lake population of fossil stickleback that he studied, which existed 10 million years ago.
- These results affirm with absolute certainty that the Pitx1 gene was involved in pelvic reduction of the fossil stickleback that he studied.
- It is impossible that the Pitx1 gene was involved in pelvic reduction of the fossil stickleback that he studied because the same gene would not have existed 10 million years ago.
- The fossil stickleback population was completely different from any modern population of stickleback that we know, and so direct comparisons of traits between them are meaningless.

Watch a video of Dr. Bell
discussing his findings.
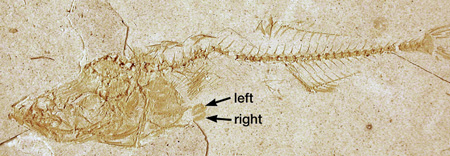
The photo above shows an example of a fossil stickleback with a reduced pelvis that is larger on the left than on the right.
Why?
It is a fact that the left pelvic vestige is larger than the right one in most fossil stickleback with reduced pelvises from the ancient lake that Dr. Bell and colleagues studied. This suggests that similar molecular mechanisms may have been responsible for pelvic reduction in fossil and modern stickleback populations.
Final Quiz Results
1. How did some ancestral sea-run stickleback populations come to live exclusively in fresh water?
- These populations swam to freshwater lakes to spawn and then never returned to the ocean because there were fewer predators in lakes.
- They became trapped in lakes that formed at the end of the last ice age.
- They don't actually live exclusively in fresh water; they only live in fresh water at certain stages in their lives.
- They developed traits that made them better adapted to fresh water and, as a result, had to move to a freshwater environment to survive.
2. What happened to these fish as they adapted to living exclusively in fresh water?
- Over many generations, populations of fish changed in many different ways, including in their skeletons.
- They acquired new characteristics by mating with fish that lived in these lakes.
- Since the new environments were so similar to their old environments, their traits changed.
- The new environments caused individual fish to change within their lifetime.
3. Is the following statement true or false? As they adapted to life in fresh water, all stickleback populations living in lakes in Alaska underwent exactly the same evolutionary changes.
- True
- False
4. Which of the following is an explanation for why the stickleback is a model organism for studying evolution?
- Stickleback populations have evolved recently and repeatedly in postglacial lakes.
- Researchers have identified some of the genetic mechanisms involved in the evolution of stickleback populations.
- The evolution of stickleback populations can be detected in the fossil record.
- All of the above.
5. Why do some stickleback populations lack pelvic spines?
- In sea water, pelvic spines help fish swim faster, but not in fresh water.
- The pelvic spines are homologous to legs in four-legged animals. Because fish don't need hind limbs to walk, many populations of fish evolved to lack pelvic spines.
- In lakes where there are no predatory fish, there is no advantage to having pelvic spines.
- Pelvic spines are thought to attract mates for reproduction in the sea but not in lakes.
6. In this virtual lab, why did you compare pelvic structures of stickleback populations from two different lakes?
- To have a larger number of specimens to score, increasing the accuracy of results.
- To compare the trait in stickleback populations living in two potentially different environments.
- Frog Lake and Bear Paw Lake are two lakes with very similar stickleback populations.
- One lake represents the control population and the other population is the one we can compare to the control.
7. How can evolutionary processes that we measure today inform our interpretations of evolutionary changes seen in the fossil record?
- If the same morphological changes occur in the fossil record as in living populations, we can infer that the genetic mechanisms discovered in living populations might be responsible for the changes observed in fossils.
- We cannot draw any conclusions by comparing living populations to the fossil record because the mechanisms by which evolution occurs have dramatically changed.
- If the same morphological changes are observed in the fossil record as in living populations, we can infer that those changes occurred at a much slower pace in specimens preserved in the fossil record compared to living populations.
- Evolution repeats itself. Therefore, any change seen in the fossil record can be seen again in current evolutionary processes, provided that the selective pressures acting on the various populations are different.
8. Which of the following is a definition of the process of natural selection?
- In each generation, some individuals may, just by chance, have more offspring than other individuals and their traits will become more common in that population.
- More advantageous traits in a particular environment allow individuals with those traits to have more offspring; as a result their heritable traits become more common in succeeding generations of the population.
- Mutations occur at random in a population causing populations to change over time as those mutations are inherited from one generation to the next.
- Only traits that are advantageous in a particular environment are preserved in the fossil record.
9. If you conducted the analysis portion of Experiment 2, you calculated the rate at which the percentage of fish with a complete pelvis decreased in that ancient lake. Do you think the same rate of change would apply to modern fish populations?
- Probably not, since the environment has changed so much in the 10 million years since that ancient lake existed.
- Although we did not measure this directly, it is possible that the same rate of change observed in the fossil record applies to modern populations.
- The fossil record analyzed in Experiment 2 only spans 15,000 years, so we cannot draw any conclusions to modern populations, which evolved over a much longer period of time, at least 10,000 years.
- The rate of evolution of a particular phenotype cannot be calculated from the fossil record because the fossil record is always fragmentary.
10. The Pitx1 gene is involved in which of the following?
- It is the gene identified to be involved in the formation of the pelvic spines in stickleback fish; this gene is not found in any other organism.
- It is the gene involved in the formation of pelvic spines in fossil stickleback populations, but scientists don't yet know whether it is involved in the formation of pelvic spines in modern fish populations.
- It is the gene that regulates the formation of hind limbs in mice and other four-legged animals; scientists don't yet know whether stickleback fish have a Pitx1 gene.
- It is the gene identified to be involved in the formation of the pelvic spines in stickleback fish, as well as hind limb development in other vertebrates, such as the mouse.
11. What is the purpose of looking for evidence of left or right bias in pelvic asymmetry in stickleback populations?
- If in a population, pelvic vestiges are larger on either the left or right side in most fish, that suggests that the Pitx1 gene is involved in this phenotype.
- Any type of asymmetry in the body indicates that the Pitx1 gene is involved.
- If the pelvic vestiges are larger on the left side in most stickleback in a population, the Pitx1 gene is probably involved in pelvic reduction.
- If the pelvic vestiges are larger on the right side in most stickleback in a population, that's evidence that the Pitx1 gene in stickleback fish is the same as the Pitx1 gene in mice.
12. Which of the following is a reason for collecting specimens by random sampling when conducting the type of research in this virtual lab?
- Random sampling increases the probability that the specimens selected for the research study are representative of the population as a whole.
- Random sampling ensures that every fish in the population is sampled.
- Random sampling ensures that the fish that are selected for the research study are most like one another.
- Random sampling is the only way to collect fish when using traps.